Fig. 12.
Download original image
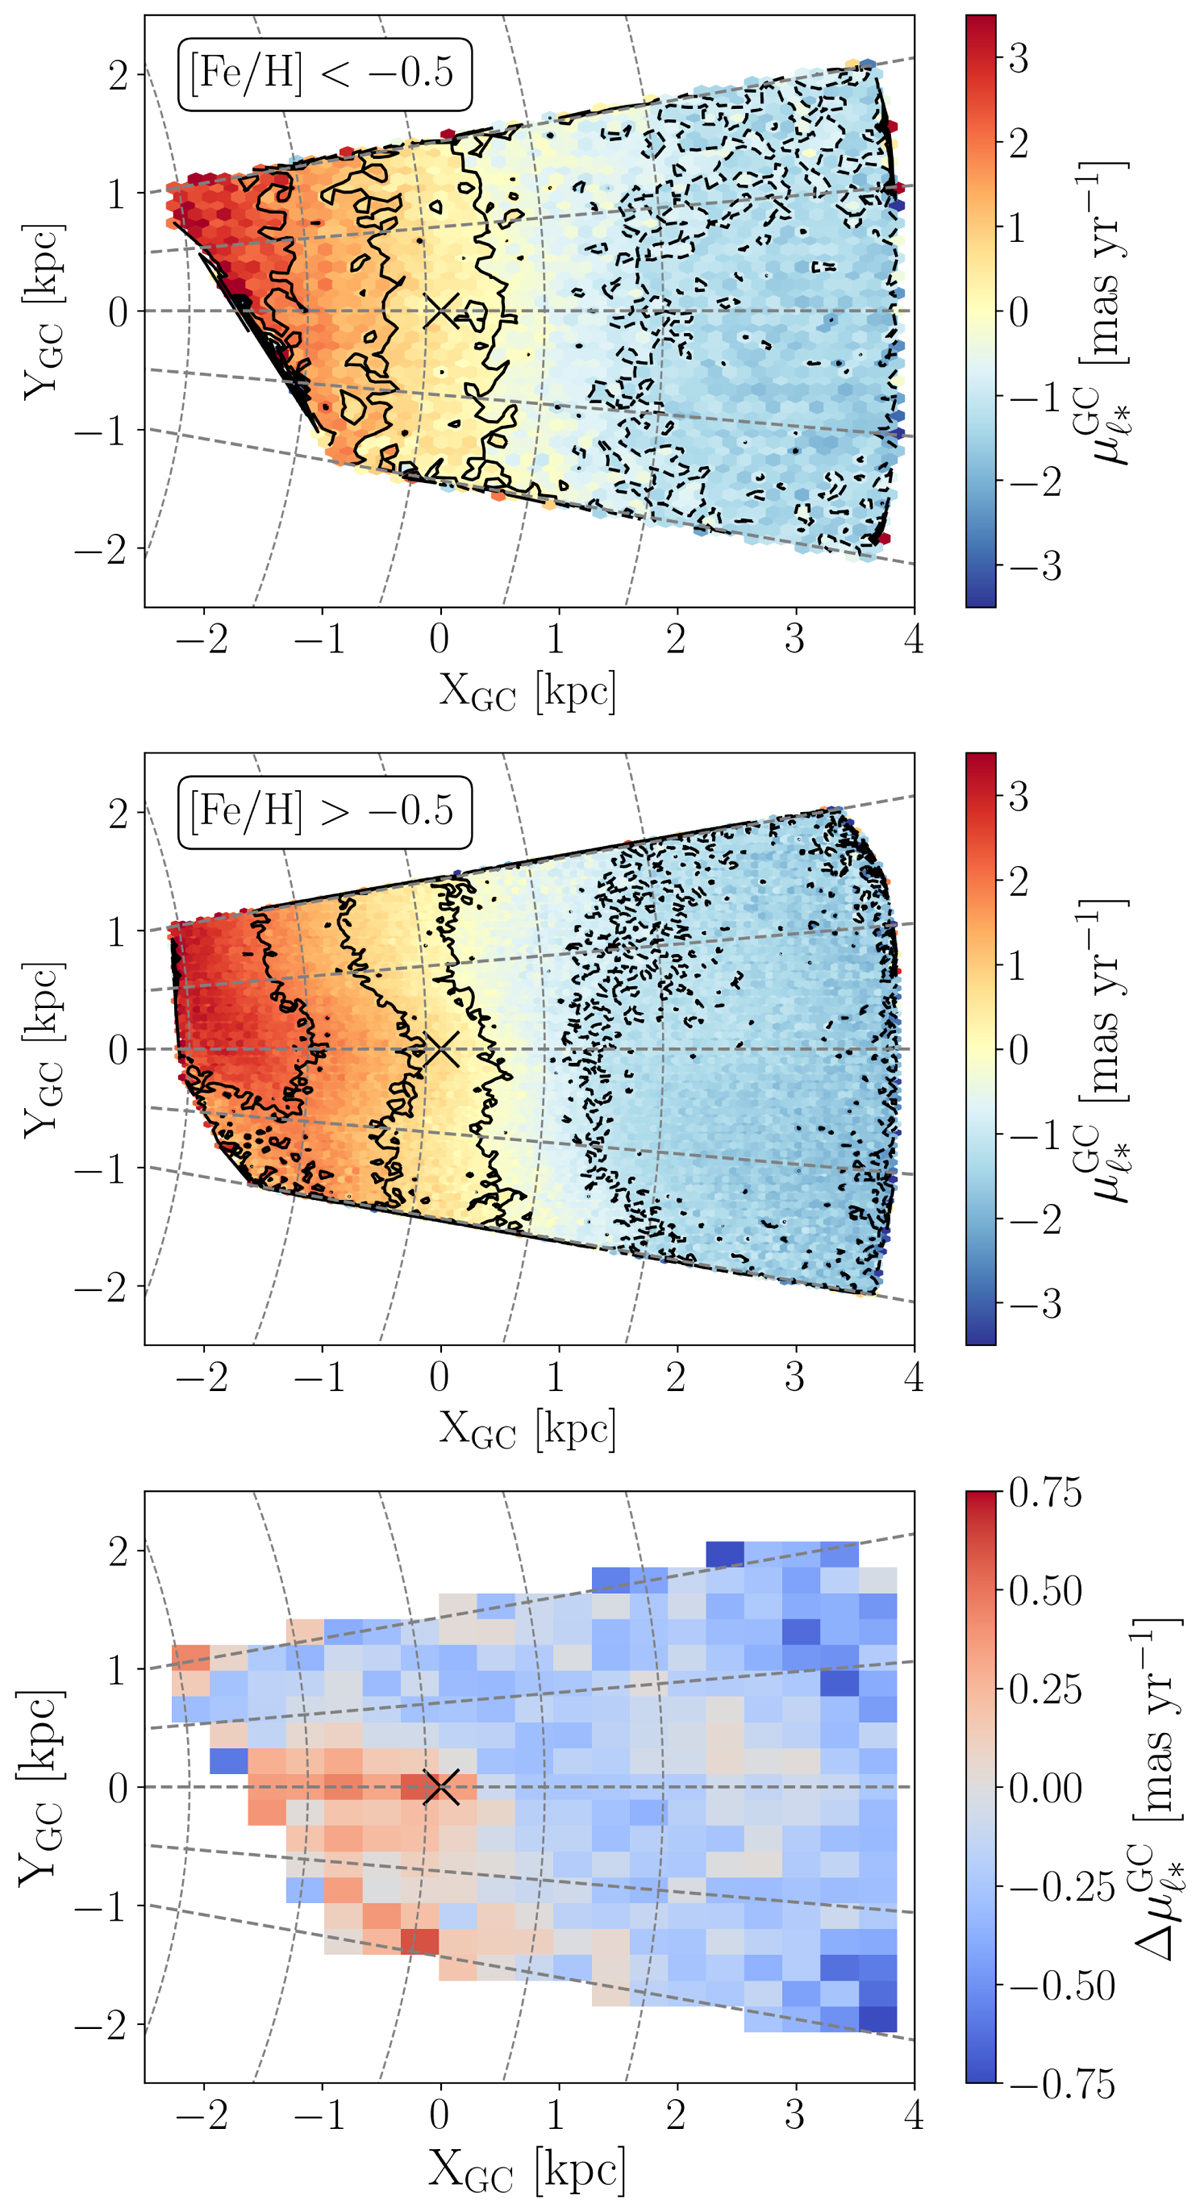
Top-down view of the sample of RC stars with [Fe/H] < −0.5 dex (top panel, ∼3 × 10⁵ stars) and [Fe/H] > −0.5 dex (middle panel, ∼2.3 × 10⁶ stars) color-coded according to the proper motion along Galactic longitude corrected by the motion of the Sun, ![]() . Black lines correspond to lines of constant
. Black lines correspond to lines of constant ![]() mas yr−1. The bottom panel is color-coded according to the difference in the mean proper motion for metal-rich ([Fe/H] > −0.5 dex) and metal-poor stars ([Fe/H] < −0.5 dex) in each spatial bin. The black cross denotes the position of the Galactic Center, and gray dashed lines are the same as in Fig. 2.
mas yr−1. The bottom panel is color-coded according to the difference in the mean proper motion for metal-rich ([Fe/H] > −0.5 dex) and metal-poor stars ([Fe/H] < −0.5 dex) in each spatial bin. The black cross denotes the position of the Galactic Center, and gray dashed lines are the same as in Fig. 2.
Current usage metrics show cumulative count of Article Views (full-text article views including HTML views, PDF and ePub downloads, according to the available data) and Abstracts Views on Vision4Press platform.
Data correspond to usage on the plateform after 2015. The current usage metrics is available 48-96 hours after online publication and is updated daily on week days.
Initial download of the metrics may take a while.