Fig. 9
Download original image
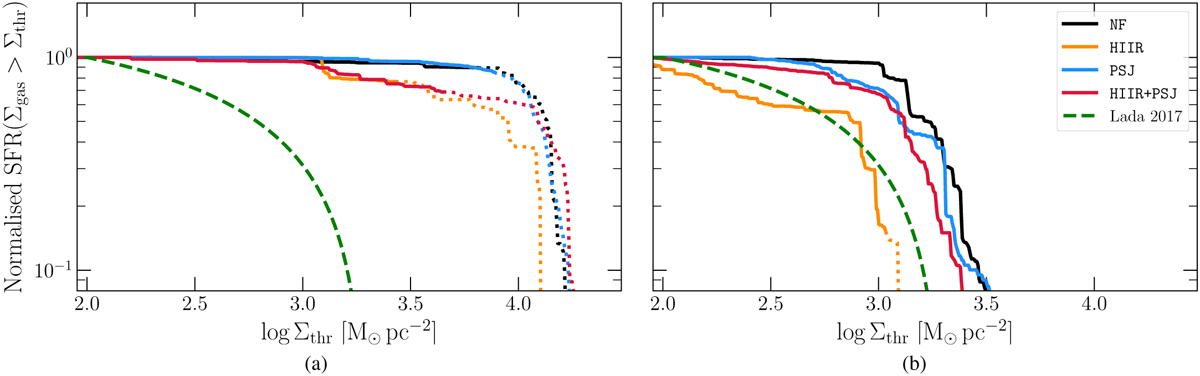
SFR of density contours as a function of their threshold column density at 3.0 Myr. The data are normalised to the total SFR at that time. The dotted part of the lines identifies isosurfaces with an area smaller than 500 pixels. The right panel shows the same distribution, but as it appears after the application of all three biases explained in the text – YSO counting for the SFR, resolution lowered to 0.05 pc, and the masking of extinct stars. The dashed green lines reproduce the model from Lada et al. (2017), with a threshold of 2000 M⊙ pc−2 and a stellar probability distribution function of PDF* ∝ ![]() .
.
Current usage metrics show cumulative count of Article Views (full-text article views including HTML views, PDF and ePub downloads, according to the available data) and Abstracts Views on Vision4Press platform.
Data correspond to usage on the plateform after 2015. The current usage metrics is available 48-96 hours after online publication and is updated daily on week days.
Initial download of the metrics may take a while.