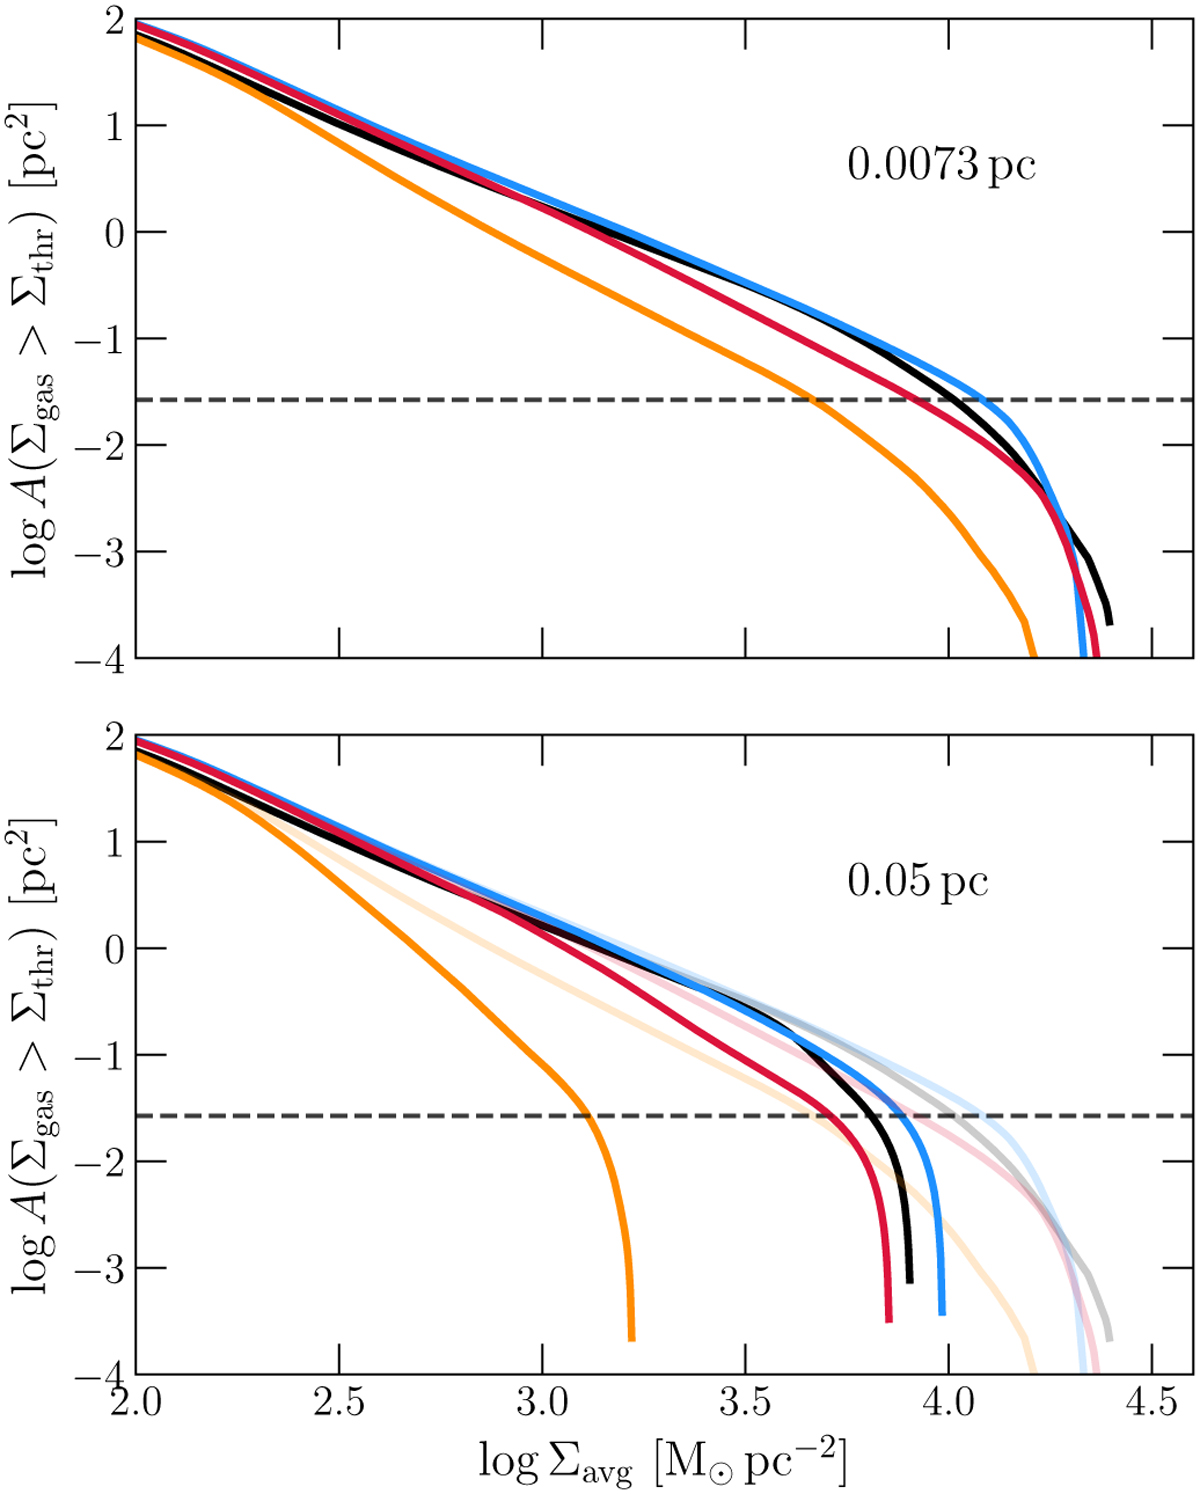
Fig. 8
Download original image
Cumulative area of the contours as a function of their average column density at 3 Myr. The two images are obtained from the original column density map (top) and the one smoothed with a Gaussian beam with 0.05 pc standard deviation (bottom). As in Fig. 7, the blended lines in the bottom panel are the ones plotted at 0.0073 pc resolution. The dashed line marks the area corresponding to the 500 pixel criterion.
Current usage metrics show cumulative count of Article Views (full-text article views including HTML views, PDF and ePub downloads, according to the available data) and Abstracts Views on Vision4Press platform.
Data correspond to usage on the plateform after 2015. The current usage metrics is available 48-96 hours after online publication and is updated daily on week days.
Initial download of the metrics may take a while.