Open Access
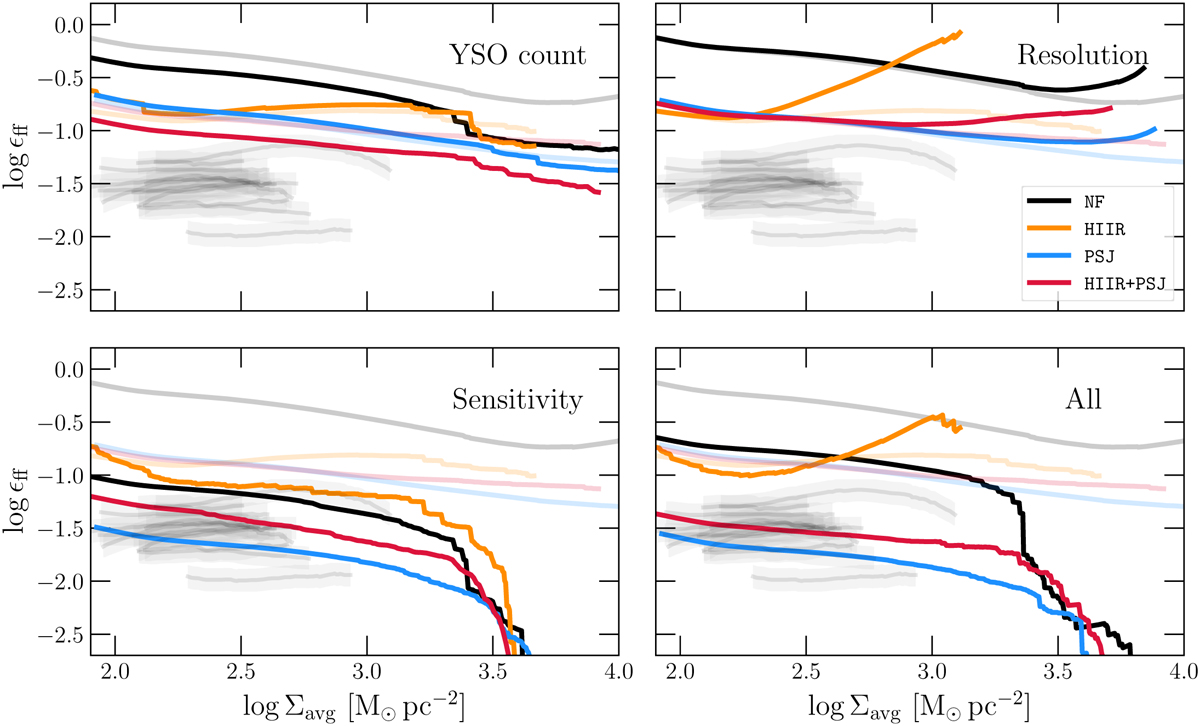
Fig. 7
Download original image
Effect of four different observational biases on the ϵff−Σavg relation of the clouds at 3 Myr. The blended curves are the same as in the 3 Myr panel of Fig. 5, and the grey lines are the 12 Galactic clouds studied in Pokhrel et al. (2021).
Current usage metrics show cumulative count of Article Views (full-text article views including HTML views, PDF and ePub downloads, according to the available data) and Abstracts Views on Vision4Press platform.
Data correspond to usage on the plateform after 2015. The current usage metrics is available 48-96 hours after online publication and is updated daily on week days.
Initial download of the metrics may take a while.