Fig. 4
Download original image
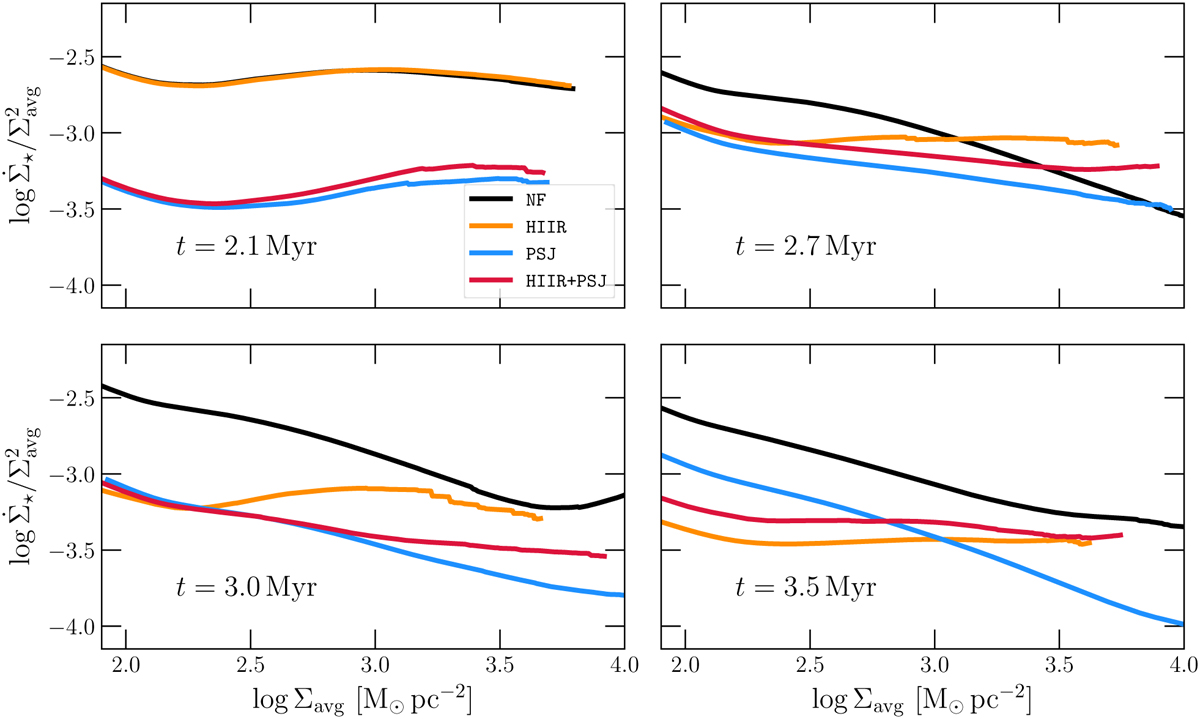
Comparison of the star formation–gas density relation between the different simulations, shown at four different times (t = 2.1, 2.7, 3.0, and 3.5 Myr), which illustrates the evolution of the cloud. In HIIR the giant H II region develops after 2.2 Myr, while for HIIR+PSJ it starts to restructure the environment at later times (> 2.75 Myr). The colour code is the same as in Fig. 2.
Current usage metrics show cumulative count of Article Views (full-text article views including HTML views, PDF and ePub downloads, according to the available data) and Abstracts Views on Vision4Press platform.
Data correspond to usage on the plateform after 2015. The current usage metrics is available 48-96 hours after online publication and is updated daily on week days.
Initial download of the metrics may take a while.