Fig. 2
Download original image
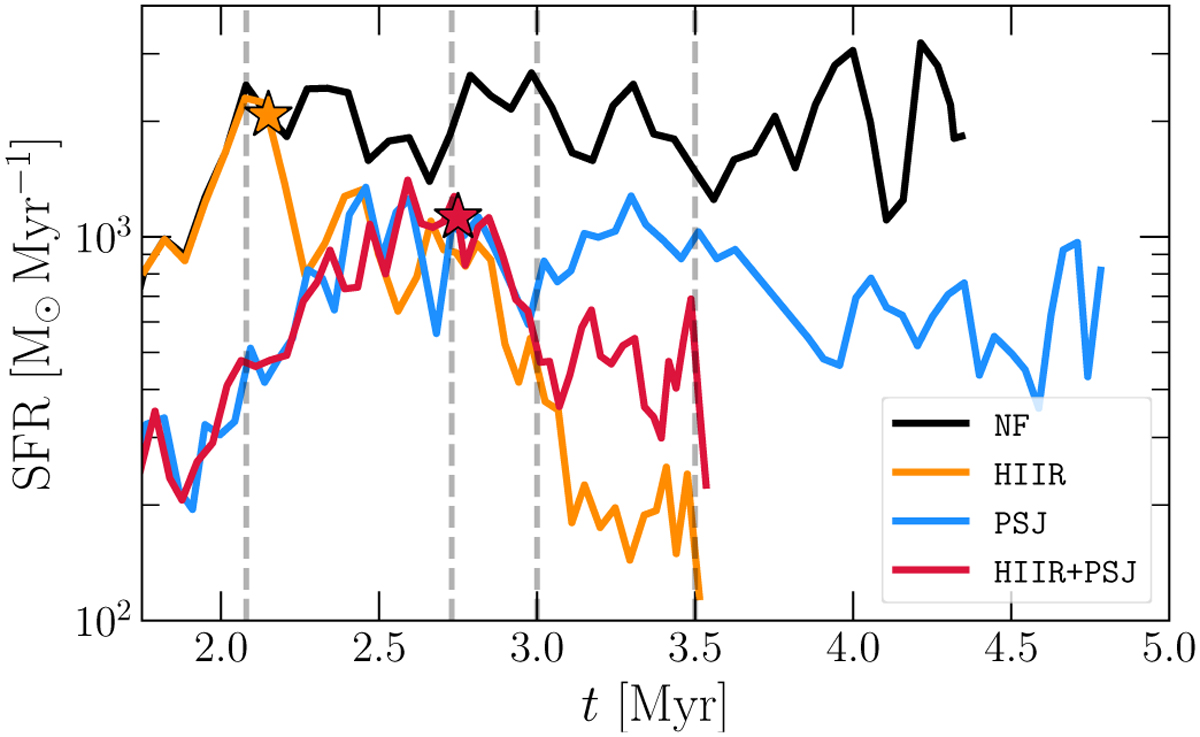
Temporal evolution of the SFR in the different simulations. The black line shows the simulation without any feedback. The run with only protostellar jets and the one with only ionising radiation are represented in blue and orange, respectively. Finally, the red line individuates the simulation with both feedback mechanisms active. The stars mark the formation of the giant H II region. The vertical dashed lines highlight the approximate time of the snapshots used in Figs. 4-5.
Current usage metrics show cumulative count of Article Views (full-text article views including HTML views, PDF and ePub downloads, according to the available data) and Abstracts Views on Vision4Press platform.
Data correspond to usage on the plateform after 2015. The current usage metrics is available 48-96 hours after online publication and is updated daily on week days.
Initial download of the metrics may take a while.