Fig. 11
Download original image
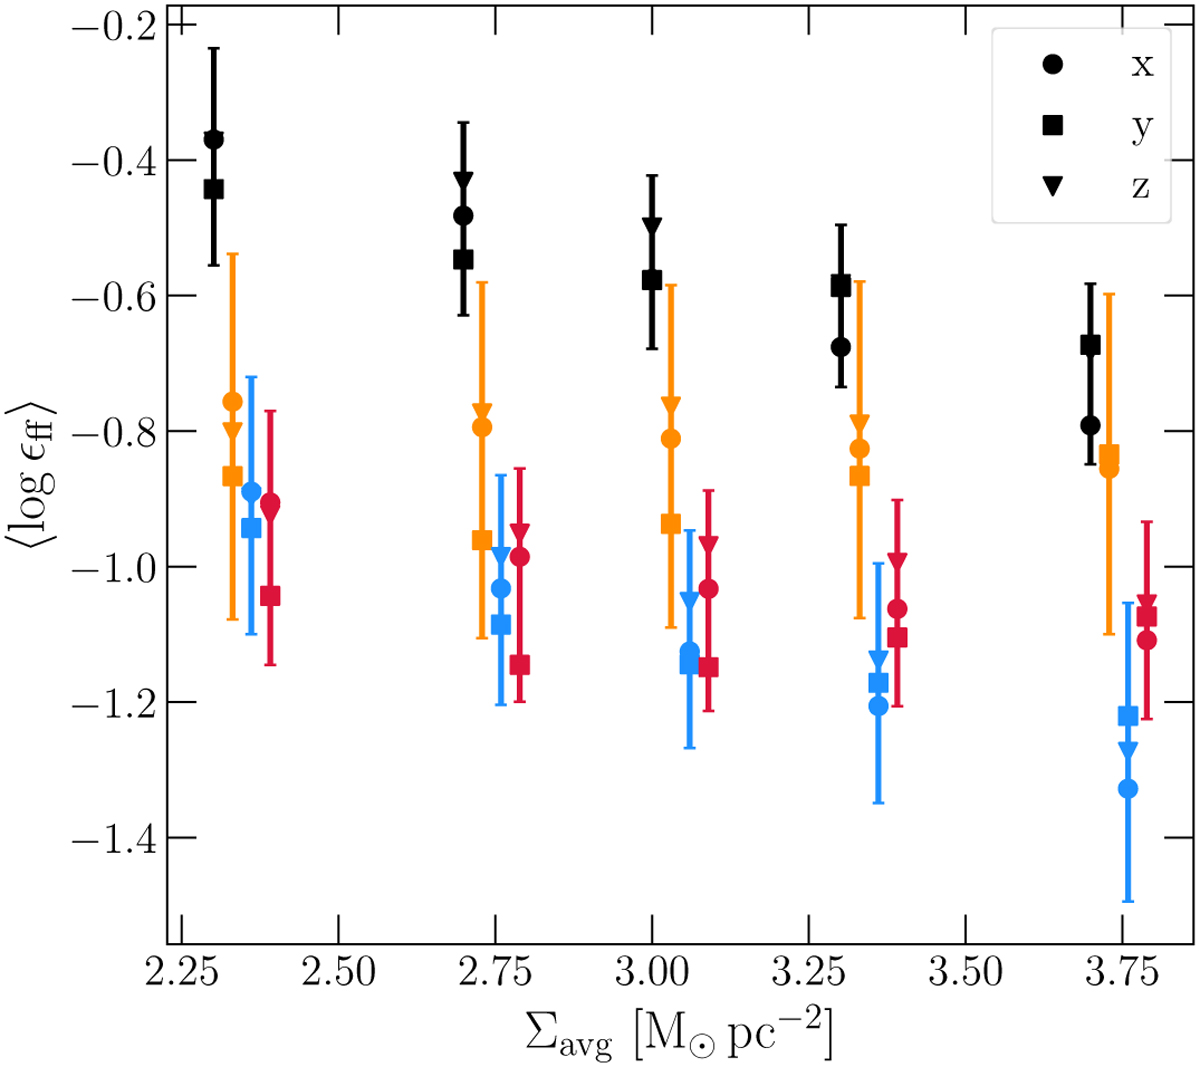
Time average of log ϵff at 250, 500, 1000, 2500, and 5000 M⊙ pc−2 in the various simulations. The data have been slightly displaced to make the comparison clearer. The different markers highlight different axes of projections, and the error bars show the dispersion of ϵff measured at a given column density due to its evolution across the simulation. The effects from the line of sight and stellar feedback are not enough to overcome this dispersion, such that in a set of clouds at different evolutionary stages they will not be visible if the dependence from Σavg is not taken into account.
Current usage metrics show cumulative count of Article Views (full-text article views including HTML views, PDF and ePub downloads, according to the available data) and Abstracts Views on Vision4Press platform.
Data correspond to usage on the plateform after 2015. The current usage metrics is available 48-96 hours after online publication and is updated daily on week days.
Initial download of the metrics may take a while.