Fig. 1
Download original image
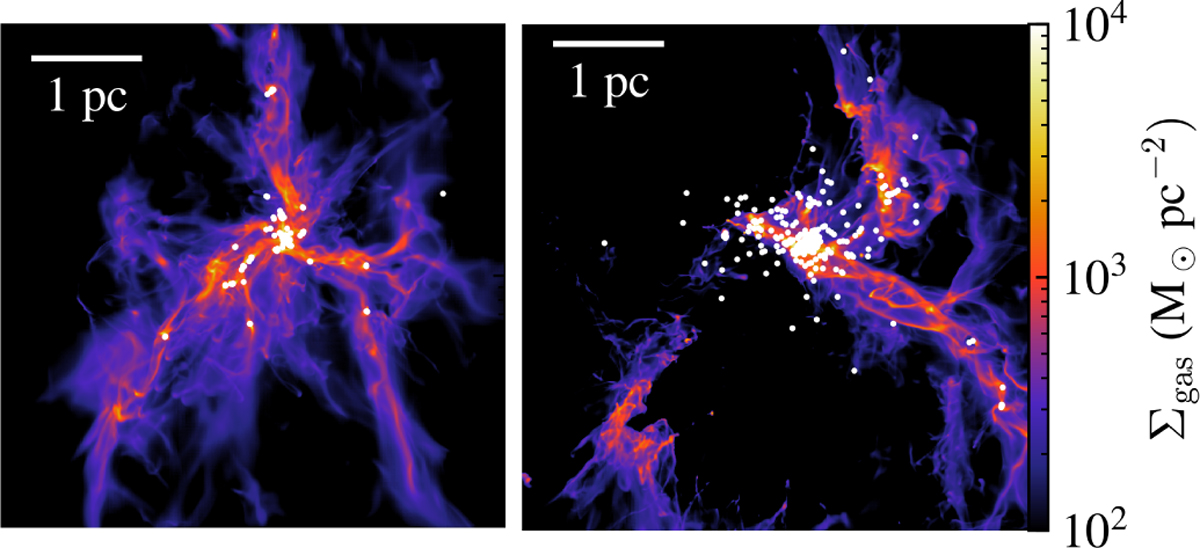
Density projections along the z-axis for two snapshots of simulation HIIR+PSJ, at 2.3 Myr (left) and 3.15 Myr (right). White dots mark the sink particles’ positions. The left panel captures the formation of the central hub, with three filaments converging into it. In the right panel we can see how the giant H II region, originating from the lower-left filament, restructured the cloud after about 0.4 Myr.
Current usage metrics show cumulative count of Article Views (full-text article views including HTML views, PDF and ePub downloads, according to the available data) and Abstracts Views on Vision4Press platform.
Data correspond to usage on the plateform after 2015. The current usage metrics is available 48-96 hours after online publication and is updated daily on week days.
Initial download of the metrics may take a while.