Fig. 2
Download original image
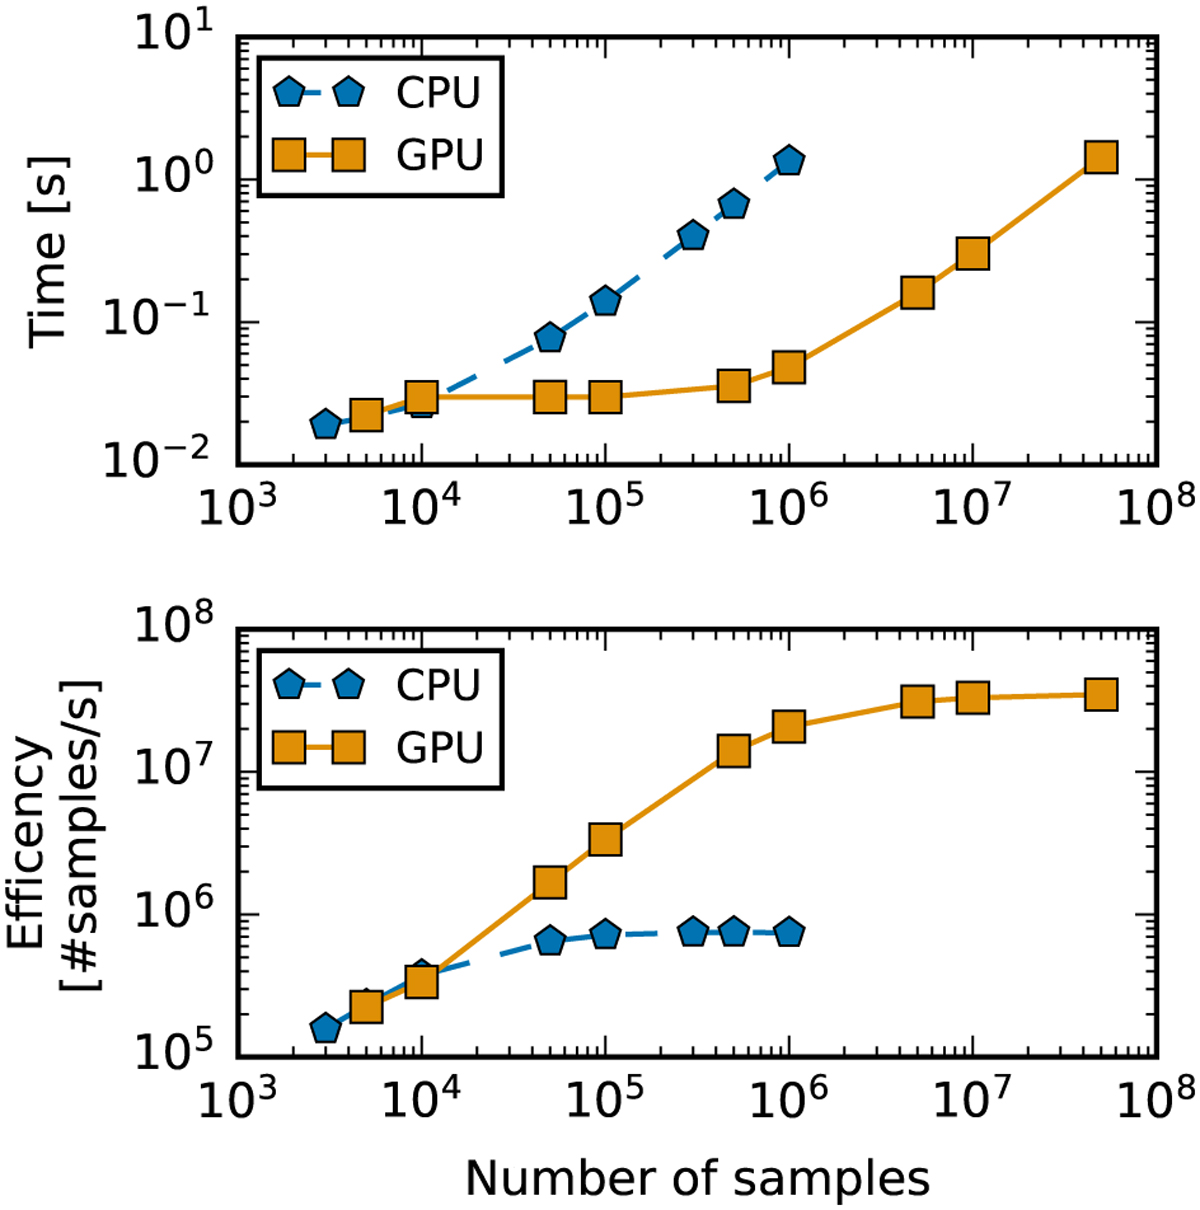
ICAROGW computational benchmarking on CPU and GPU. Top: average elapsed time taken by ICAROGW to evaluate the hierarchical likelihood in Eq. (1). Bottom: efficiency, defined as number of samples processed per second to evaluate the hierarchical likelihood in Eq. (1). For both panels, the CPU is reported with blue pentagons and GPU with orange squares. The two panels are reported as a function of a number of samples, namely, the sum of the number of PE samples and injections used for the computation. The CPU markers are generated up to 106 samples since at 105 samples the efficiency is already saturated. Figures generated with double float precision on CPU Intel Core i9-11950H (8 cores HT, 2.6–5.0 GHz Turbo) and GPU NVIDIA GeForce RTX3080 (16Gb GDDR6, 6144 cores CUDA).
Current usage metrics show cumulative count of Article Views (full-text article views including HTML views, PDF and ePub downloads, according to the available data) and Abstracts Views on Vision4Press platform.
Data correspond to usage on the plateform after 2015. The current usage metrics is available 48-96 hours after online publication and is updated daily on week days.
Initial download of the metrics may take a while.