Open Access
Fig. A.1.
Download original image
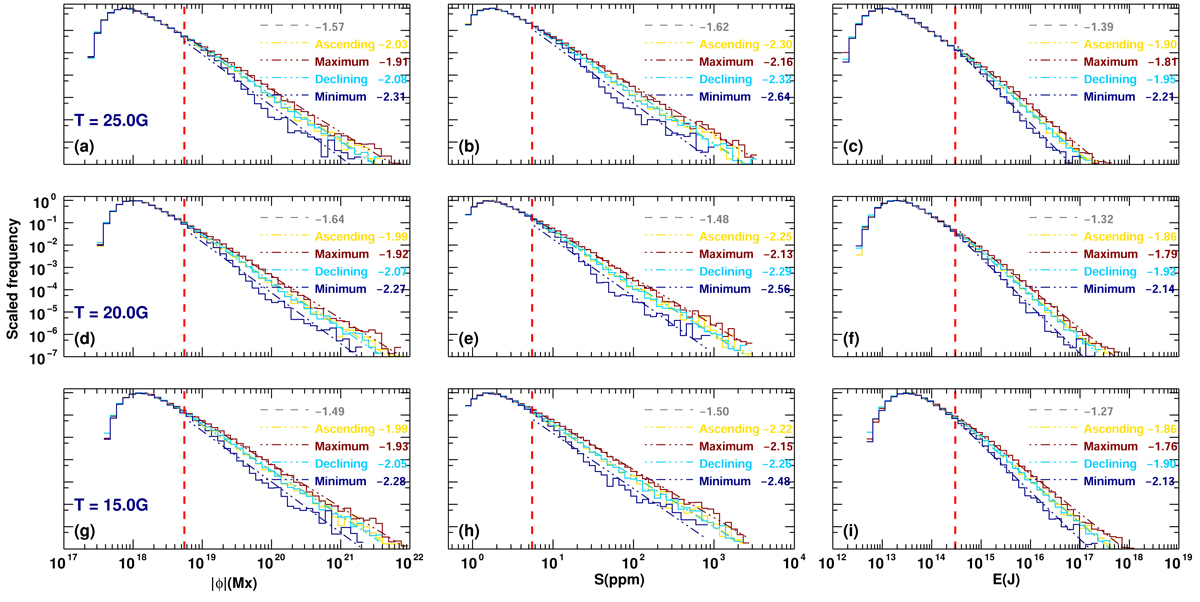
Distributions of parameters corresponding to different phases in the solar cycle. (a, b, c): The threshold value T = 25G. (d, e, f), (g, h, i): Same as (a, b, c), but for T = 20G and 15G, respectively.
Current usage metrics show cumulative count of Article Views (full-text article views including HTML views, PDF and ePub downloads, according to the available data) and Abstracts Views on Vision4Press platform.
Data correspond to usage on the plateform after 2015. The current usage metrics is available 48-96 hours after online publication and is updated daily on week days.
Initial download of the metrics may take a while.