Fig. 6.
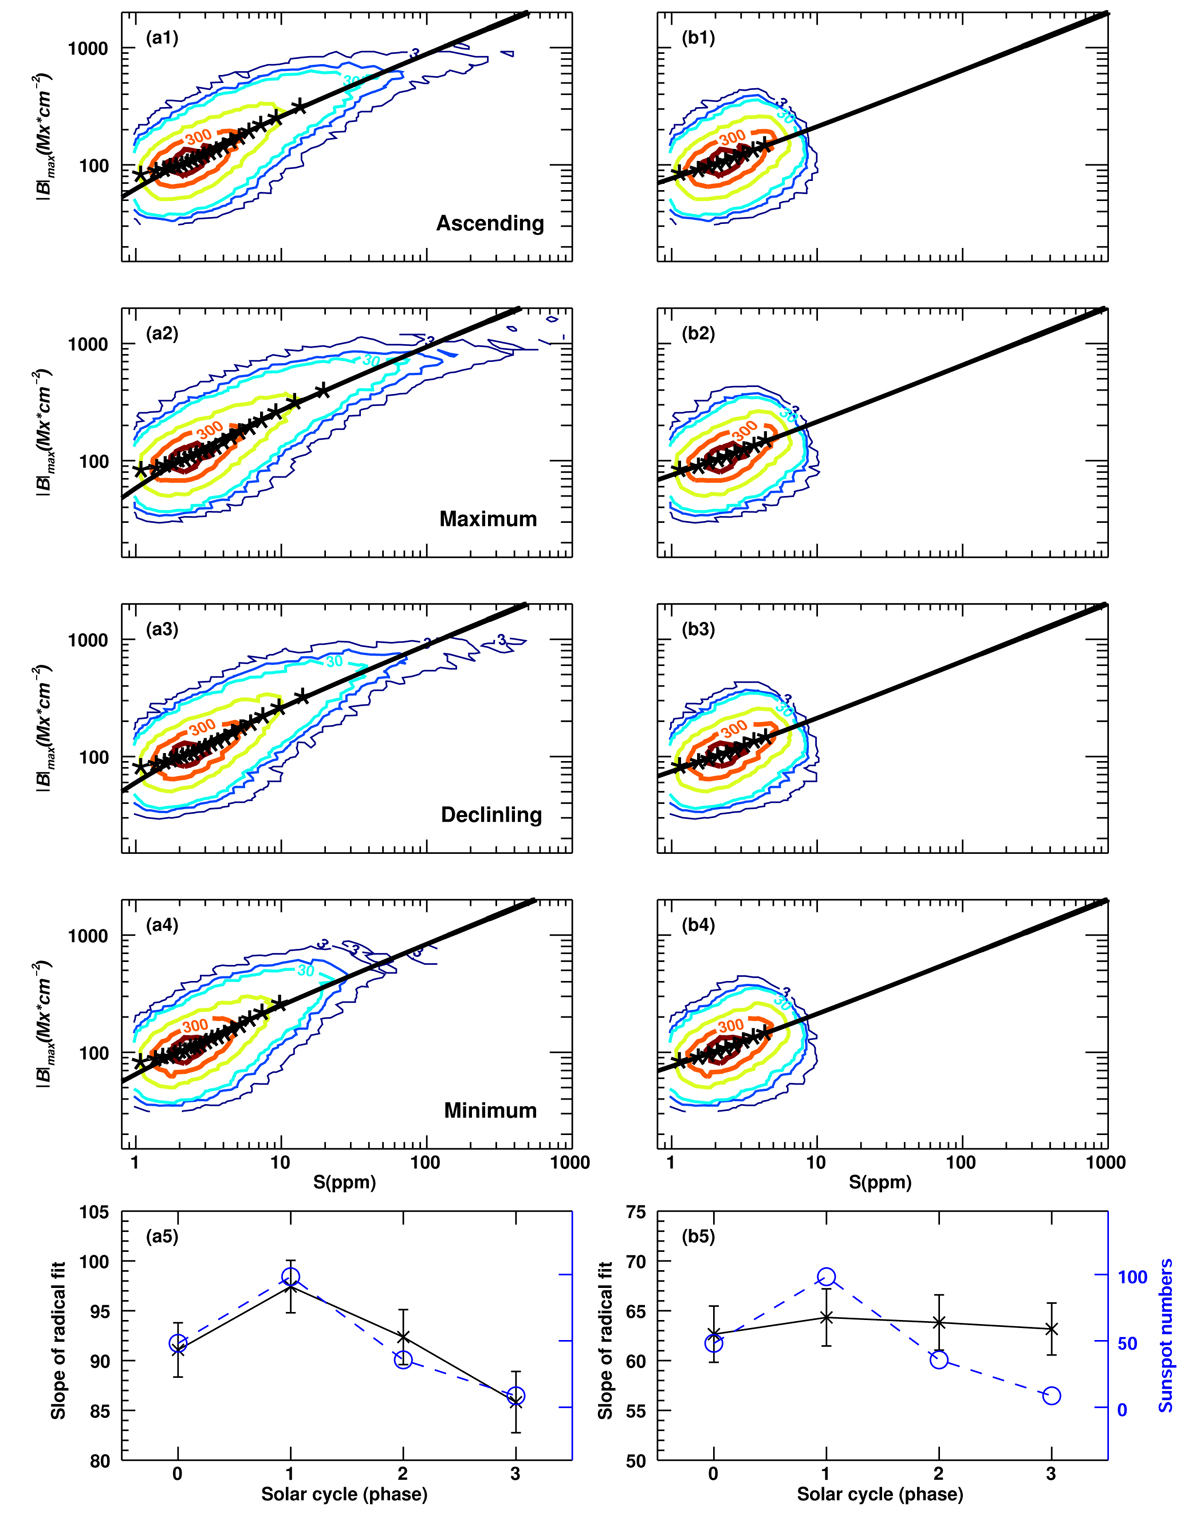
Download original image
Relationships between S and Bmax of MC. Panel a1, a2, a3, a4: number density of MCs in Bmax and S space in different solar-cycle phases. The contour lines correspond to 3, 15, 30, 150, 300, and 450 MCs. The black line shows the square-root fit. Panel a5: square-root fit coefficient α versus sunspot number. The blue dashed line shows sunspot numbers. The Φ of MCs in panels b1, b2, b3, b4, and b5 is less than 5.5 × 10¹⁸ Mx.
Current usage metrics show cumulative count of Article Views (full-text article views including HTML views, PDF and ePub downloads, according to the available data) and Abstracts Views on Vision4Press platform.
Data correspond to usage on the plateform after 2015. The current usage metrics is available 48-96 hours after online publication and is updated daily on week days.
Initial download of the metrics may take a while.