Fig. 4.
Download original image
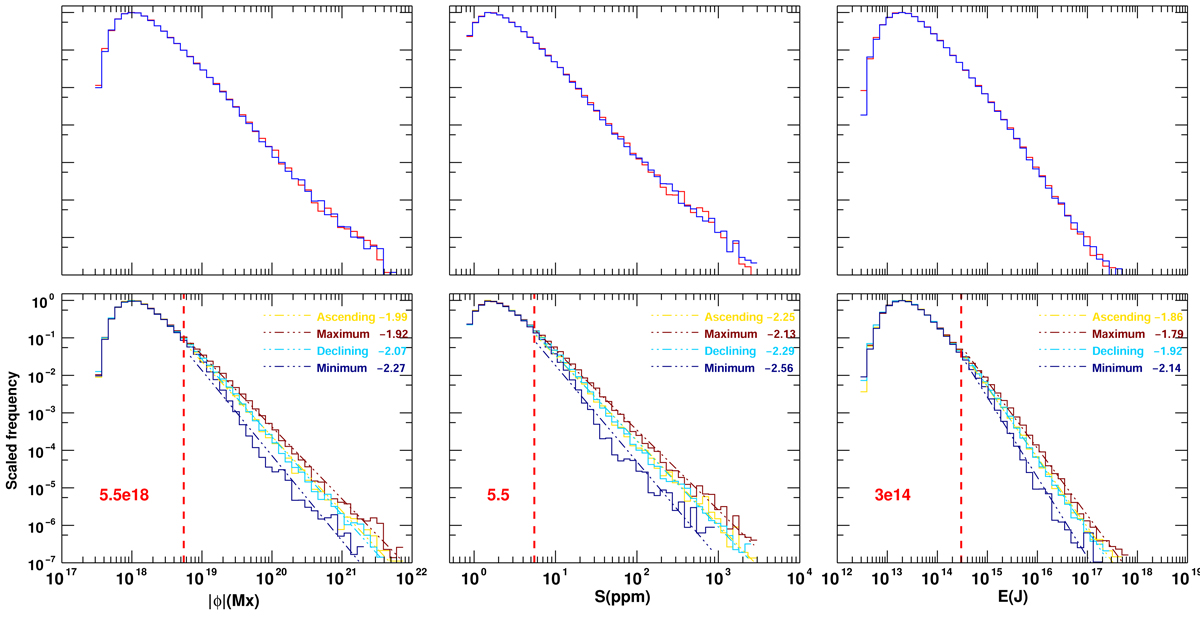
Histogram of the physical parameters of the MCs in our data set. The parameters from left to right are magnetic flux (Φ), area (S), and magnetic energy (E). Top (a1, b1, c1): red line represents the distributions of positive MCs and blue line represents distributions of negative MCs. Bottom (a2, b2, c2): distributions of parameters corresponding to different phases in the solar cycle. The curves corresponding to different phases are signed with different colors. For the ascending, maximum, declining, and minimum phases, the corresponding colors are yellow, deep red, blue, and dark blue. The gray dashed line shows the power-law fitting of the distributions of the parameters of the MCs with small parameters. Dashed colored lines show power-law fits to the distributions of the parameters of the MCs with large parameters in different phases. The power index for each phase is given in the legend. The red dashed line indicates the broken point.
Current usage metrics show cumulative count of Article Views (full-text article views including HTML views, PDF and ePub downloads, according to the available data) and Abstracts Views on Vision4Press platform.
Data correspond to usage on the plateform after 2015. The current usage metrics is available 48-96 hours after online publication and is updated daily on week days.
Initial download of the metrics may take a while.