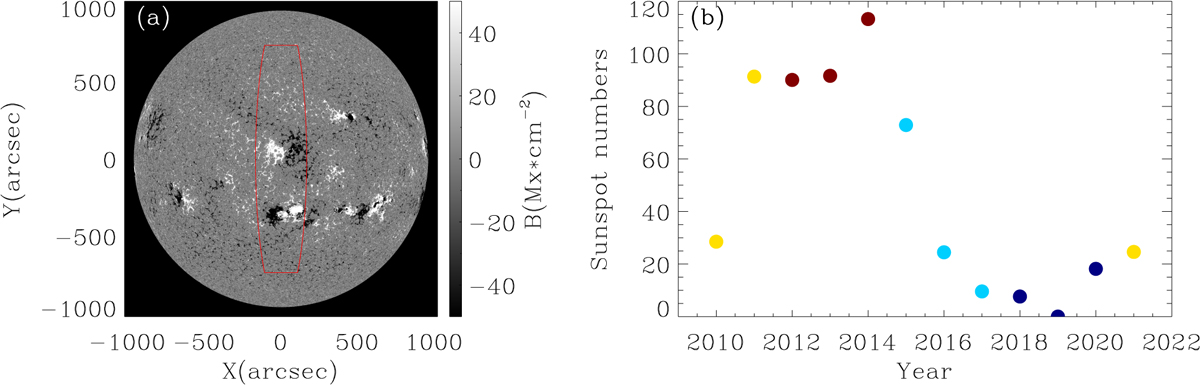
Fig. 3.
Download original image
Magnetograms and averaged sunspot number. Panel a: photospheric solar disk magnetic field observation by HMI on 2 December 2014 12:00:00. The color represents the strength of magnetic field. The region marked by the red lines shows −50° to ∼50° in latitude and −10° to ∼10° in longitude. Panel b: day-averaged sunspot numbers in each year during the time of data sets. The colors represent the phases: Yellow for ascending phase, deep red for maximum phase, blue for declining phase, and dark blue for minimum phase.
Current usage metrics show cumulative count of Article Views (full-text article views including HTML views, PDF and ePub downloads, according to the available data) and Abstracts Views on Vision4Press platform.
Data correspond to usage on the plateform after 2015. The current usage metrics is available 48-96 hours after online publication and is updated daily on week days.
Initial download of the metrics may take a while.