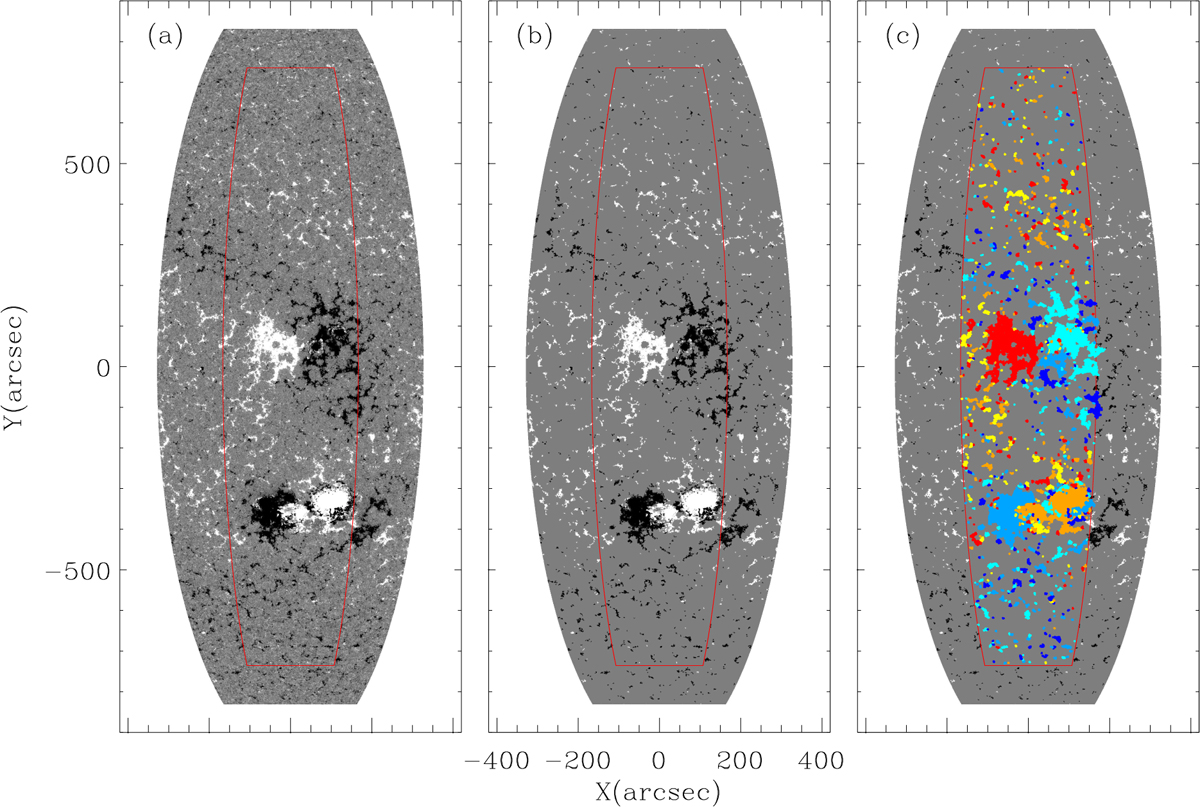
Fig. 2.
Download original image
Demonstration of the procedure used to identify MCs. The magnetogram is a cut-out from the magnetogram of Fig. 3a. The same region is marked by the red lines as in Fig. 3. From panel a to panel b we show the processes of noise removal and the erode method in the clumping method. Panel c shows the identified MCs from panel b. All MCs have been colored (positive MCs: warm tones; negative MCs: cold tones).
Current usage metrics show cumulative count of Article Views (full-text article views including HTML views, PDF and ePub downloads, according to the available data) and Abstracts Views on Vision4Press platform.
Data correspond to usage on the plateform after 2015. The current usage metrics is available 48-96 hours after online publication and is updated daily on week days.
Initial download of the metrics may take a while.