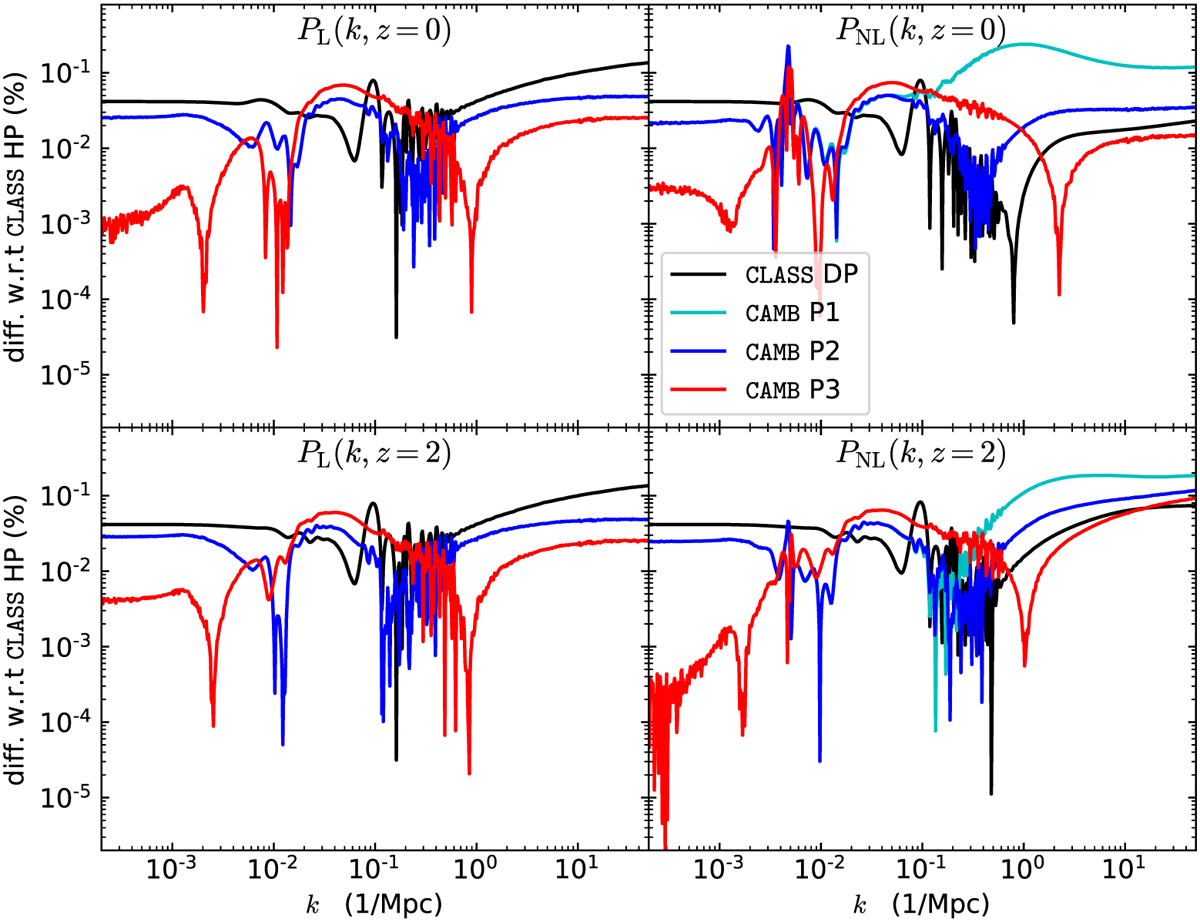
Fig. 15
Download original image
For the linear (left) and nonlinear (right) matter power spectrum of the fiducial model at redshift z = 0 (top) and z = 2 (bottom), percentage difference between the predictions of CLASS and CAMB. Here, the reference is the CLASS high-precision (HP) result. We compare it with CLASS Default Precision (DP) and CAMB with the precision settings defined as P1, P2, P3 in the text. In the linear case (left), the CAMB P1 curve is always overdrawn by the P2 one, since the difference between P1 and P2 is only relevant at the level of the nonlinear spectrum.
Current usage metrics show cumulative count of Article Views (full-text article views including HTML views, PDF and ePub downloads, according to the available data) and Abstracts Views on Vision4Press platform.
Data correspond to usage on the plateform after 2015. The current usage metrics is available 48-96 hours after online publication and is updated daily on week days.
Initial download of the metrics may take a while.