Fig. 1
Download original image
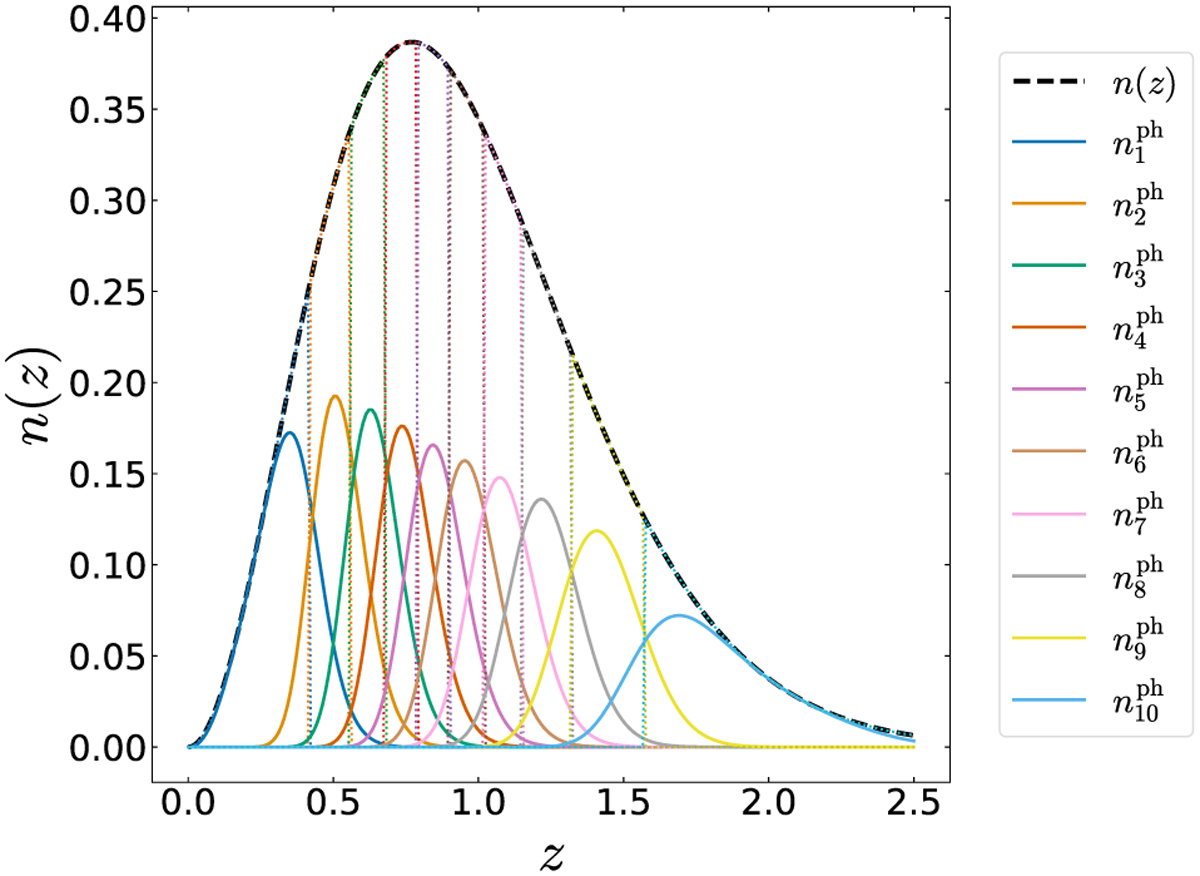
Underlying theoretical distribution of the number density of galaxies n(z) (black dashed line), normalised to one, together with the ni(z) (solid colored lines) at each of the 10 tomographic redshift bins (dotted vertical colored lines), normalised to 1/10. The ni(z) are wide and overlap each other due to the photometric redshift errors.
Current usage metrics show cumulative count of Article Views (full-text article views including HTML views, PDF and ePub downloads, according to the available data) and Abstracts Views on Vision4Press platform.
Data correspond to usage on the plateform after 2015. The current usage metrics is available 48-96 hours after online publication and is updated daily on week days.
Initial download of the metrics may take a while.