Open Access
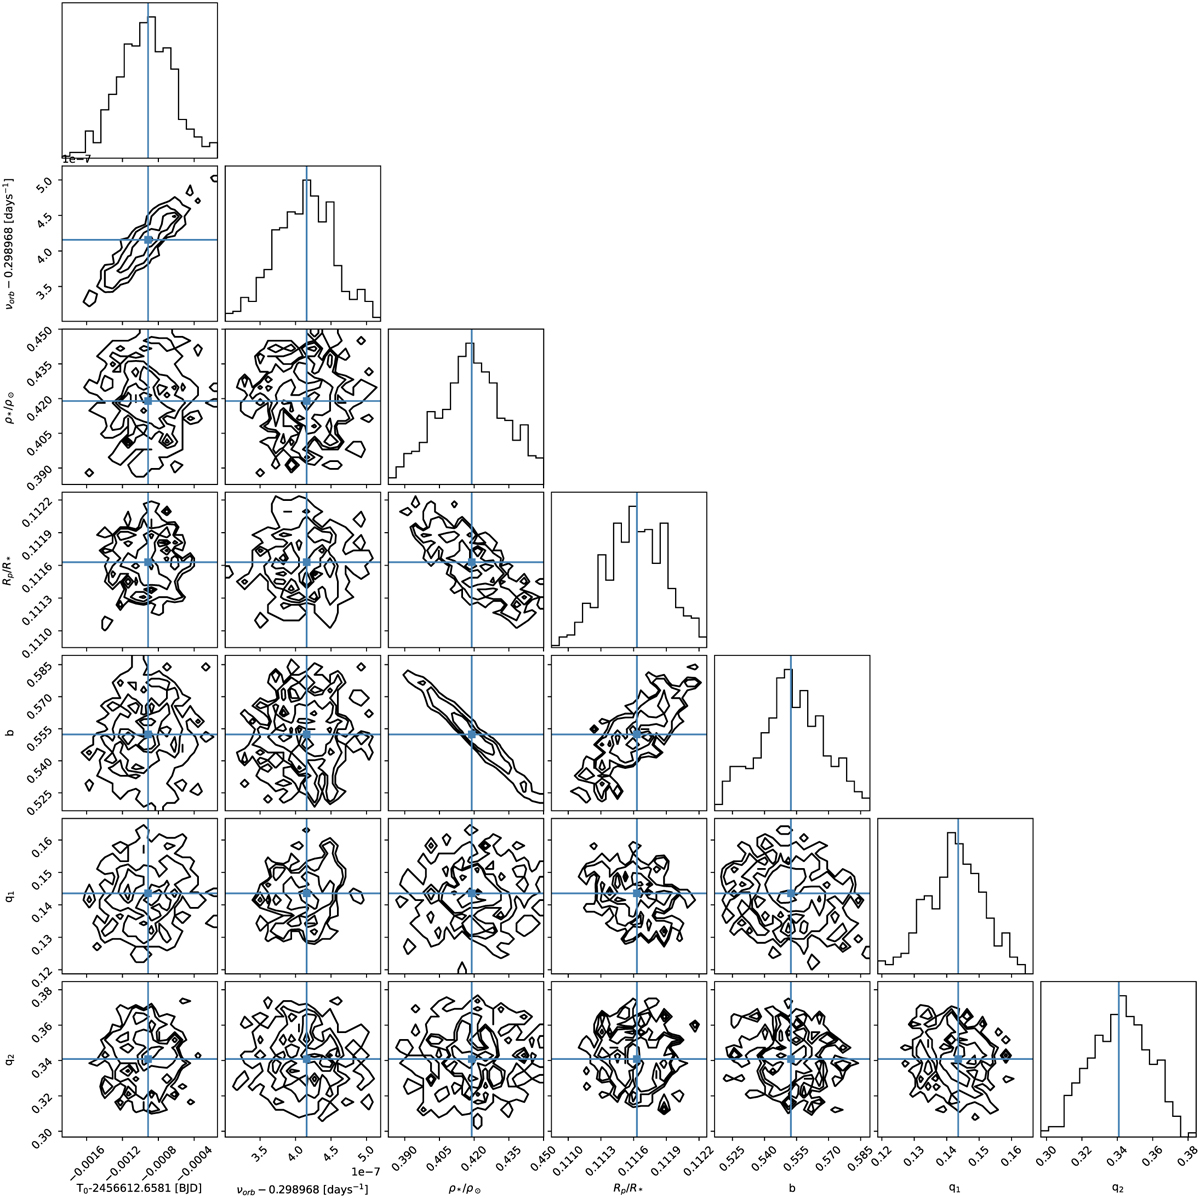
Fig. A.1
Download original image
Corner plot of the MCMC chains of planetary parameters from the fit of the TESS transits (see Sect. 4.1.1). In each plot, the solid blue lines mark the MAP values.
Current usage metrics show cumulative count of Article Views (full-text article views including HTML views, PDF and ePub downloads, according to the available data) and Abstracts Views on Vision4Press platform.
Data correspond to usage on the plateform after 2015. The current usage metrics is available 48-96 hours after online publication and is updated daily on week days.
Initial download of the metrics may take a while.