Fig. 2
Download original image
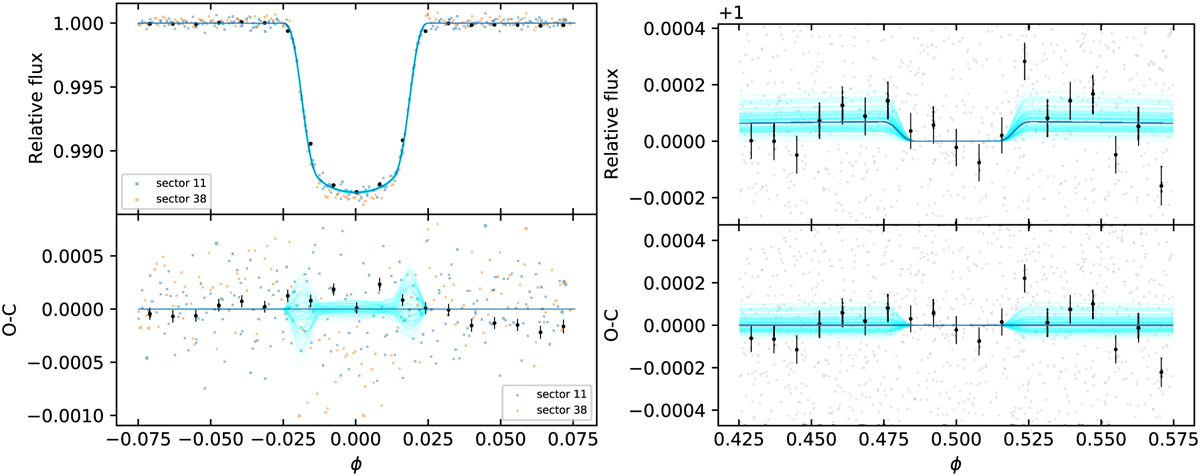
Best fit of the transits and eclipses observed by TESS. Left: detrended and phase-folded planetary transits (top panel). The photometry of sectors 11 and 38 is shown with different colors to emphasize the difference in transit depth (the photometry of sectors 11 and 38 is systematically offset upward and downward, respectively, with respect to the best-fit transit profile). The solid blue line is the best-fit model, and the cyan lines represent 100 models corresponding to random samples of the MCMC fit. For the sake of comparison, the photometry of sector 38 and that of the theoretical models are rebinned to the same 30-min cadence as for sector 11. The black dots represent the rebinned photometry. The corresponding O-C diagram is shown in the bottom panel. Right: same as in the left panel, but centered on the eclipse. For clarity, we do not mark the two sectors with different colors.
Current usage metrics show cumulative count of Article Views (full-text article views including HTML views, PDF and ePub downloads, according to the available data) and Abstracts Views on Vision4Press platform.
Data correspond to usage on the plateform after 2015. The current usage metrics is available 48-96 hours after online publication and is updated daily on week days.
Initial download of the metrics may take a while.