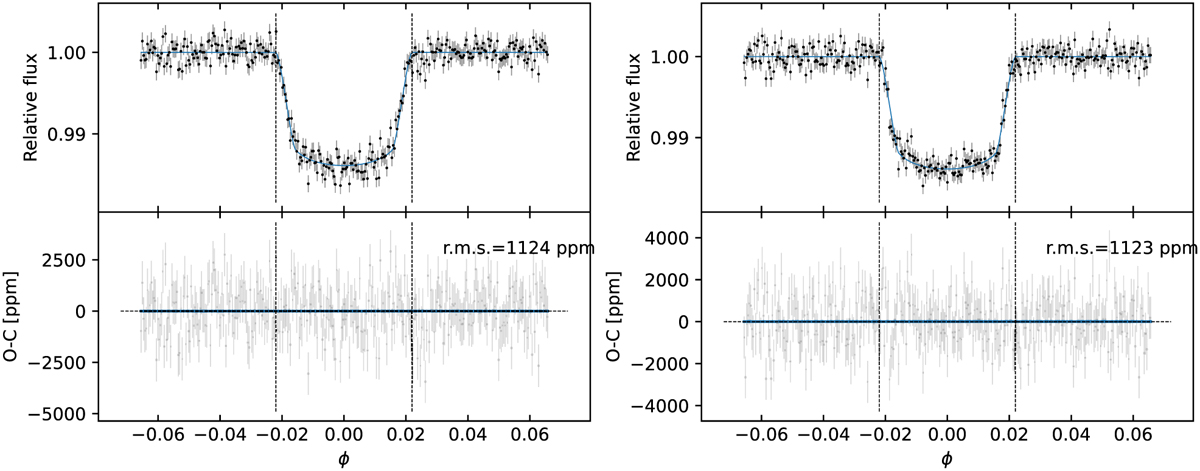
Fig. B.1
Download original image
Detrended short-cadence LC of the first (left panel) and second (right panel) transit observed in TESS sector 38. In each panel, the top plot shows the model computed with the MAP parameters in Table 3 as the solid blue line. The bottom plots show the residuals of the short-cadence photometry with respect to the planetary model shown in the top panel. As a guide, we plot the smoothing of the residuals obtained with a Savitzky-Golay filter as the blue line. In all plots, the vertical dashed lines mark the first and fourth contact.
Current usage metrics show cumulative count of Article Views (full-text article views including HTML views, PDF and ePub downloads, according to the available data) and Abstracts Views on Vision4Press platform.
Data correspond to usage on the plateform after 2015. The current usage metrics is available 48-96 hours after online publication and is updated daily on week days.
Initial download of the metrics may take a while.