Fig. 1
Download original image
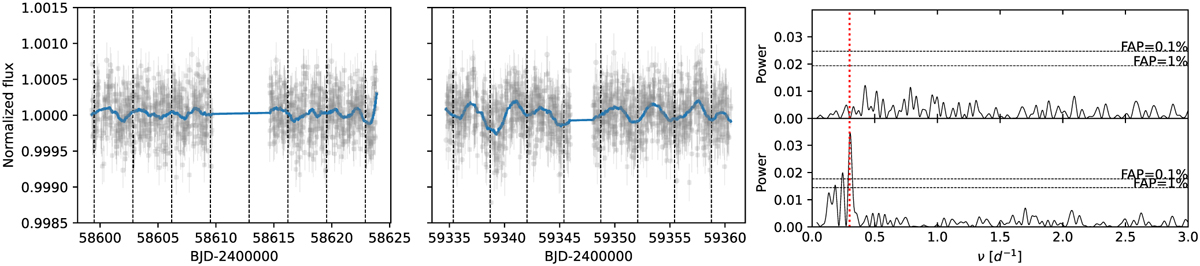
Out-of-transit and out-of-eclipse 30-min cadence TESS photometry of WASP-178 during sector 11 (left panel) and sector 38 (central panel). In each panel, the dashed vertical lines mark the planetary transit, and the solid blue line is a smoothing of the data points to emphasize the correlated noise. The right panel shows the GLS periodogram of sectors 11 and 38 (top and bottom box, respectively). In each box, we report the bootstrap-computed 0.1% and 1% FAP levels (horizontal dashes) and the planetary orbital period (vertical dotted red line).
Current usage metrics show cumulative count of Article Views (full-text article views including HTML views, PDF and ePub downloads, according to the available data) and Abstracts Views on Vision4Press platform.
Data correspond to usage on the plateform after 2015. The current usage metrics is available 48-96 hours after online publication and is updated daily on week days.
Initial download of the metrics may take a while.