Fig. 6.
Download original image
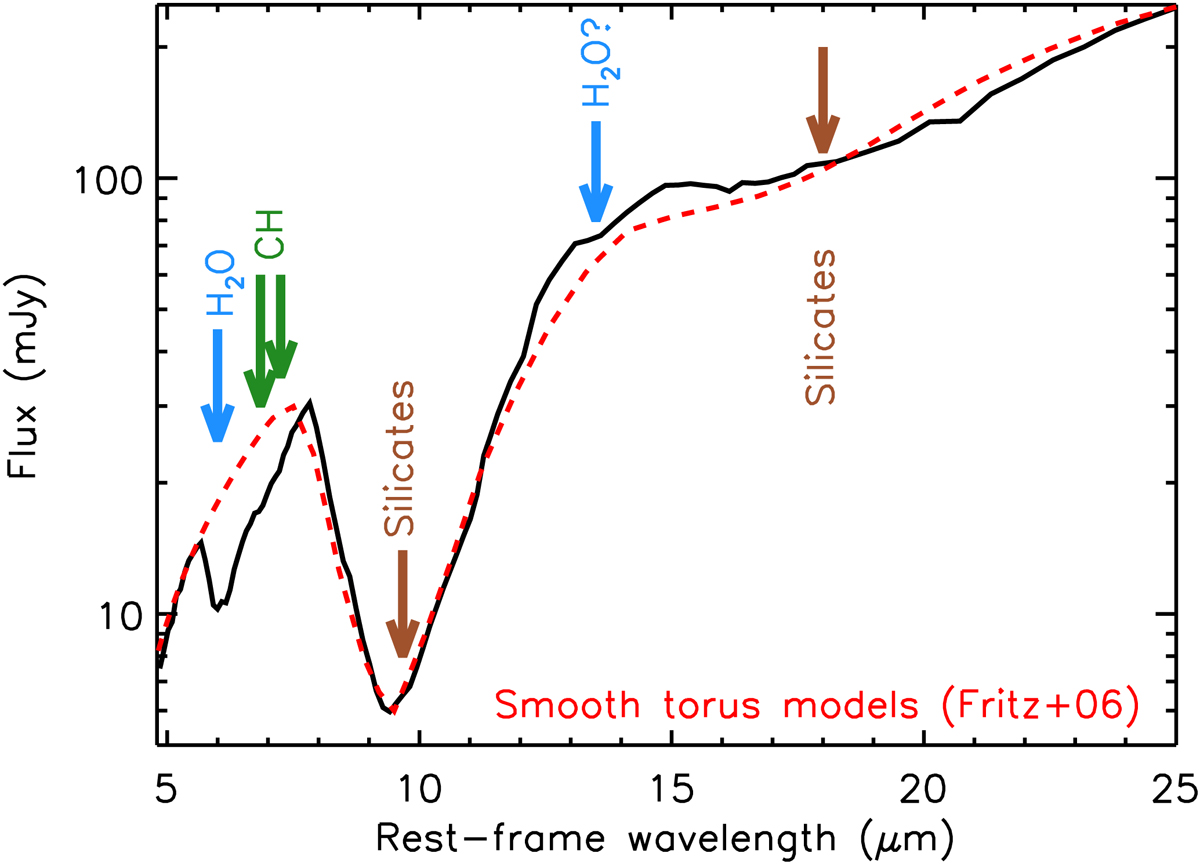
Comparison of the nuclear spectrum of NGC 5728 (narrow emission lines and PAH features have been removed; red solid line) and the best-fit torus model (dashed green line) in the 5–25 μm region. The blue arrows correspond to the absoption bands of the H2O bending mode (∼6–8 μm) and libration (∼11–16 μm) mode. The brown lines represent the 9.7 and 18.0 μm silicate features. The green arrows correspond to the absorption bands of C–H at 6.85 and 7.25 μm.
Current usage metrics show cumulative count of Article Views (full-text article views including HTML views, PDF and ePub downloads, according to the available data) and Abstracts Views on Vision4Press platform.
Data correspond to usage on the plateform after 2015. The current usage metrics is available 48-96 hours after online publication and is updated daily on week days.
Initial download of the metrics may take a while.