Fig. 5.
Download original image
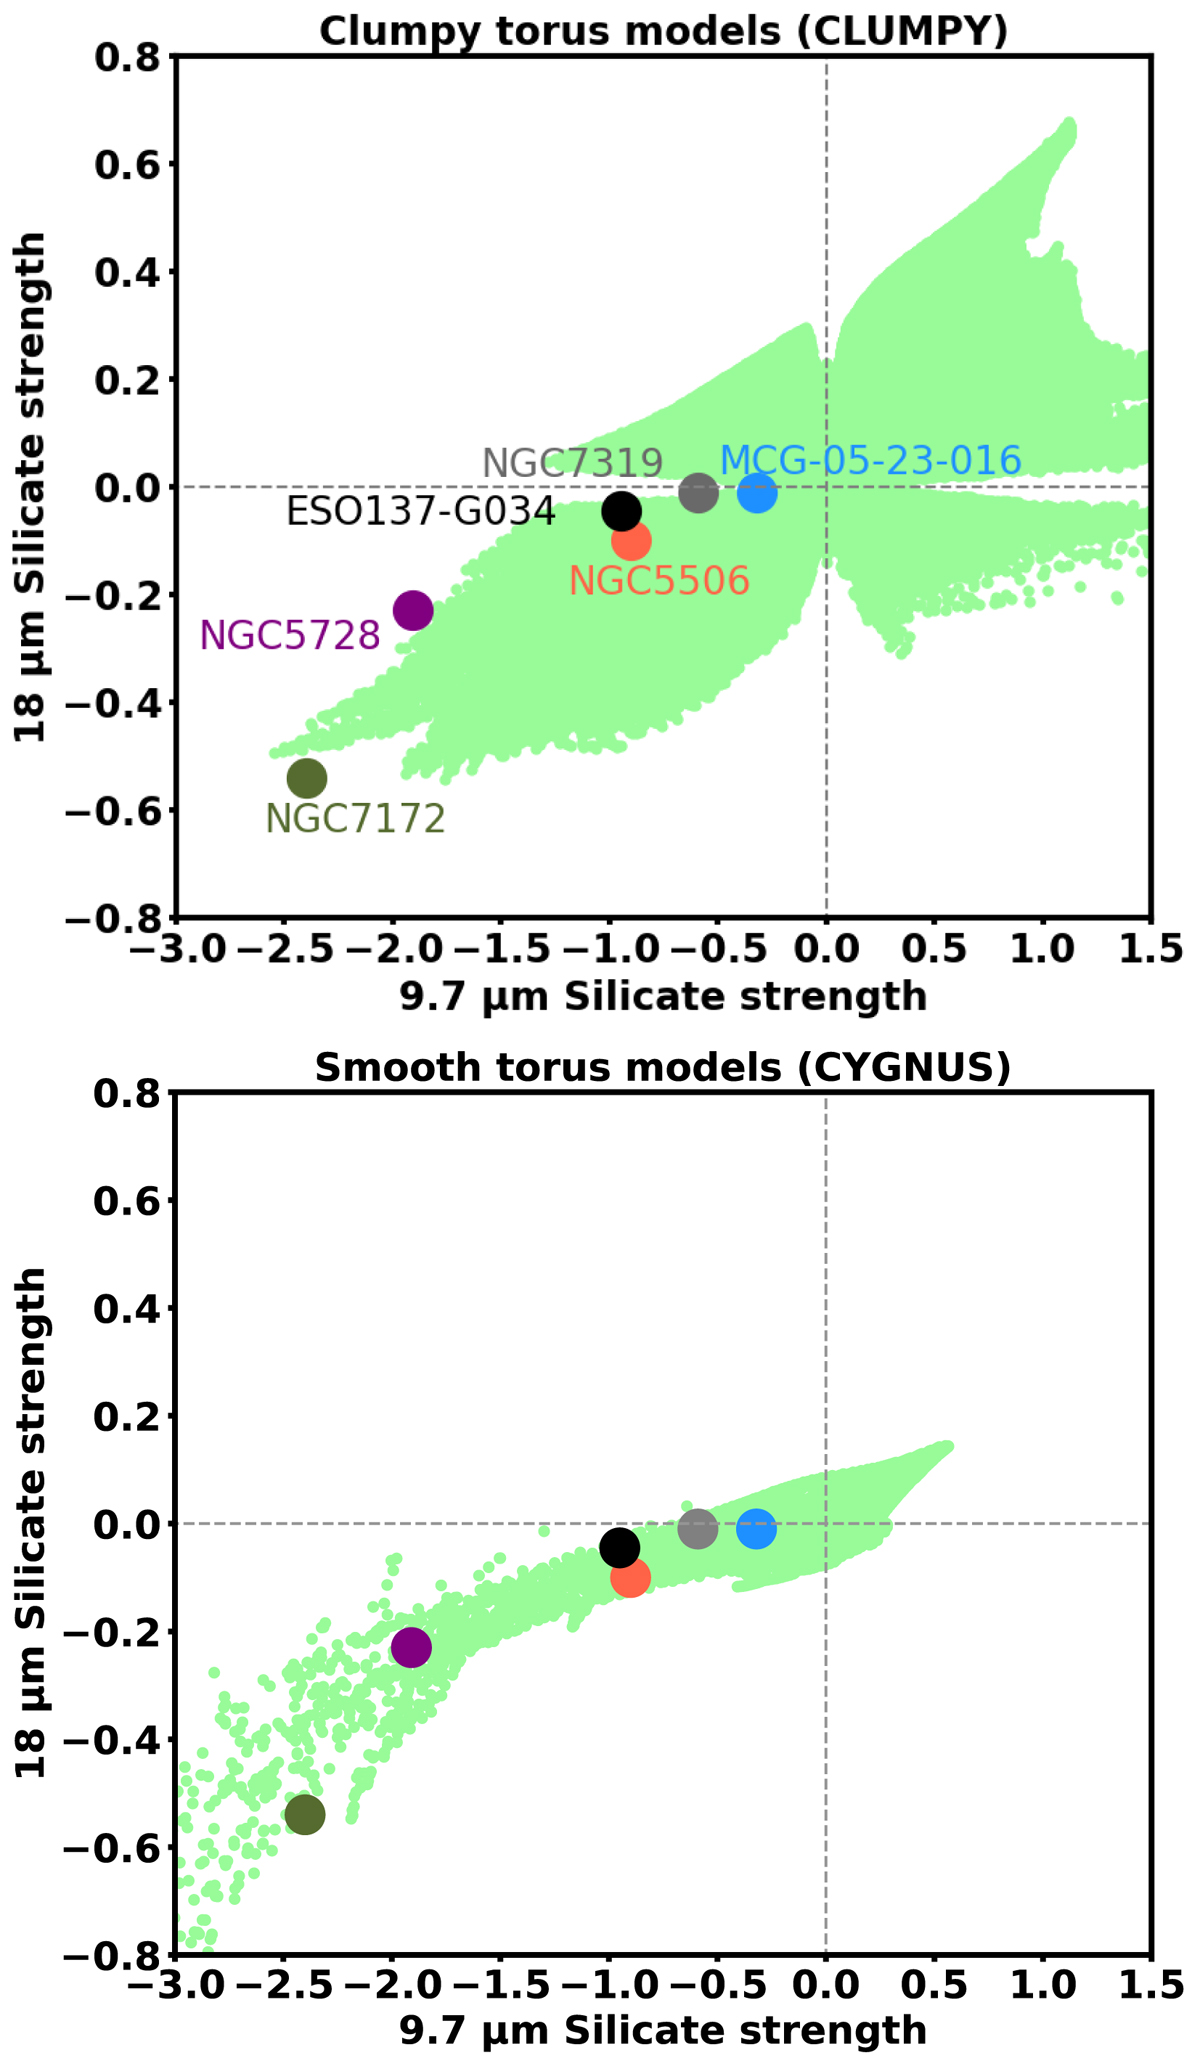
Comparison of the observed 9.7 and 18 μm silicate strengths of the sample (dots, color-coded as in Figs. 1 and 2) with those covered by three different sets of torus models (green dots). Top panel: clumpy torus models (Nenkova et al. 2008a,b). Bottom panel: smooth torus models (Efstathiou & Rowan-Robinson 1995; Efstathiou et al. 2022). Martínez-Paredes et al. (2020; their Fig. 6) show a similar plot that uses the additional clumpy and smooth torus models available in the literature.
Current usage metrics show cumulative count of Article Views (full-text article views including HTML views, PDF and ePub downloads, according to the available data) and Abstracts Views on Vision4Press platform.
Data correspond to usage on the plateform after 2015. The current usage metrics is available 48-96 hours after online publication and is updated daily on week days.
Initial download of the metrics may take a while.