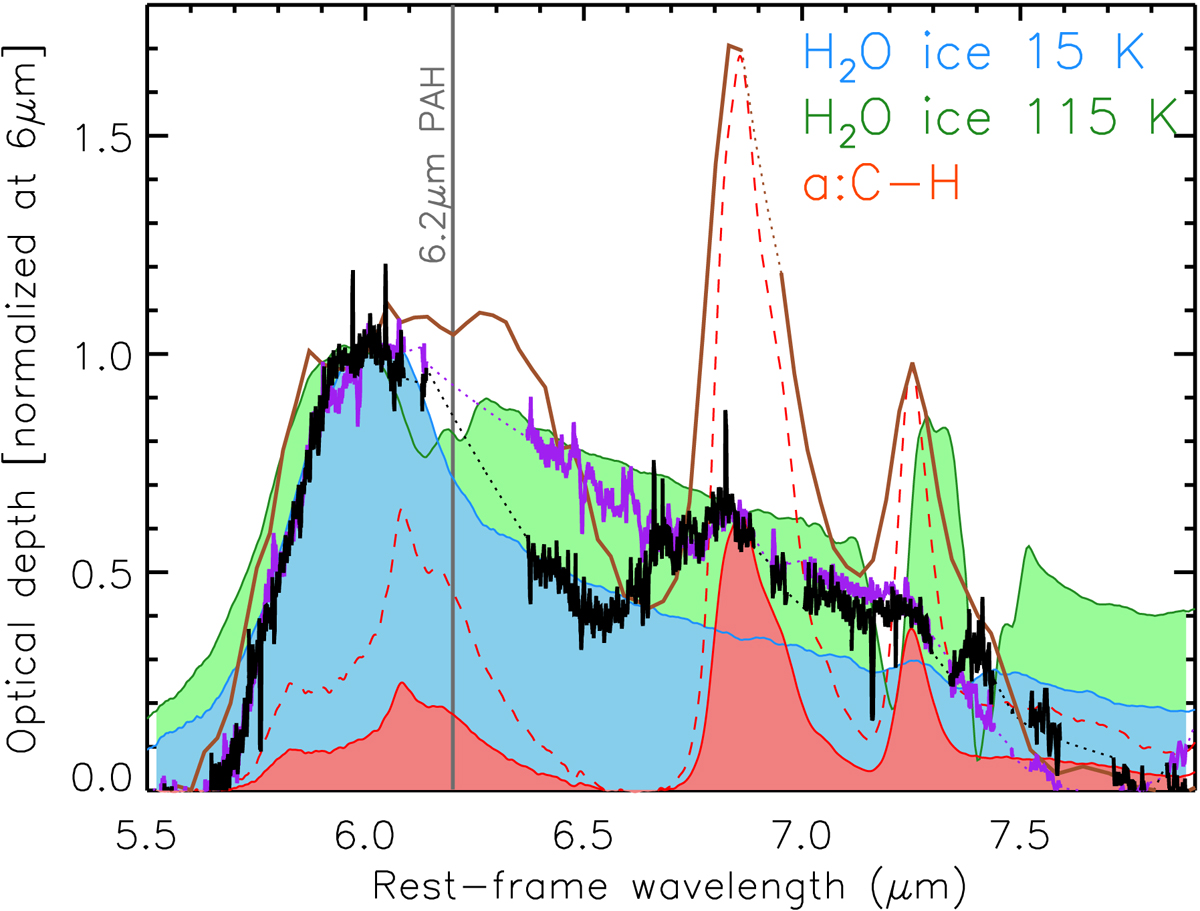
Fig. C.3.
Download original image
Optical depth of the Compton thick sources normalized at 9.7 μm. Left: Optical depth profiles of NGC 4418 (brown line), NGC 5728 (purple line), and ESO 137-G034 (black solid line). Right: Zoomed-in image of the H2O bending mode absorption band. The laboratory spectra of pure water (blue and green shaded regions correspond to H2O at 15 and 115 K, respectively; Ehrenfreund et al. 1997; Öberg et al. 2007) and a a:C-H hydrogenated amorphous carbon analog (red shaded region; Dartois & Muñoz-Caro 2007, see also Maté et al. 2019) are shown (see Spoon et al. 2022, their Fig. 29, for a similar plot).
Current usage metrics show cumulative count of Article Views (full-text article views including HTML views, PDF and ePub downloads, according to the available data) and Abstracts Views on Vision4Press platform.
Data correspond to usage on the plateform after 2015. The current usage metrics is available 48-96 hours after online publication and is updated daily on week days.
Initial download of the metrics may take a while.