Open Access
Fig. C.1.
Download original image
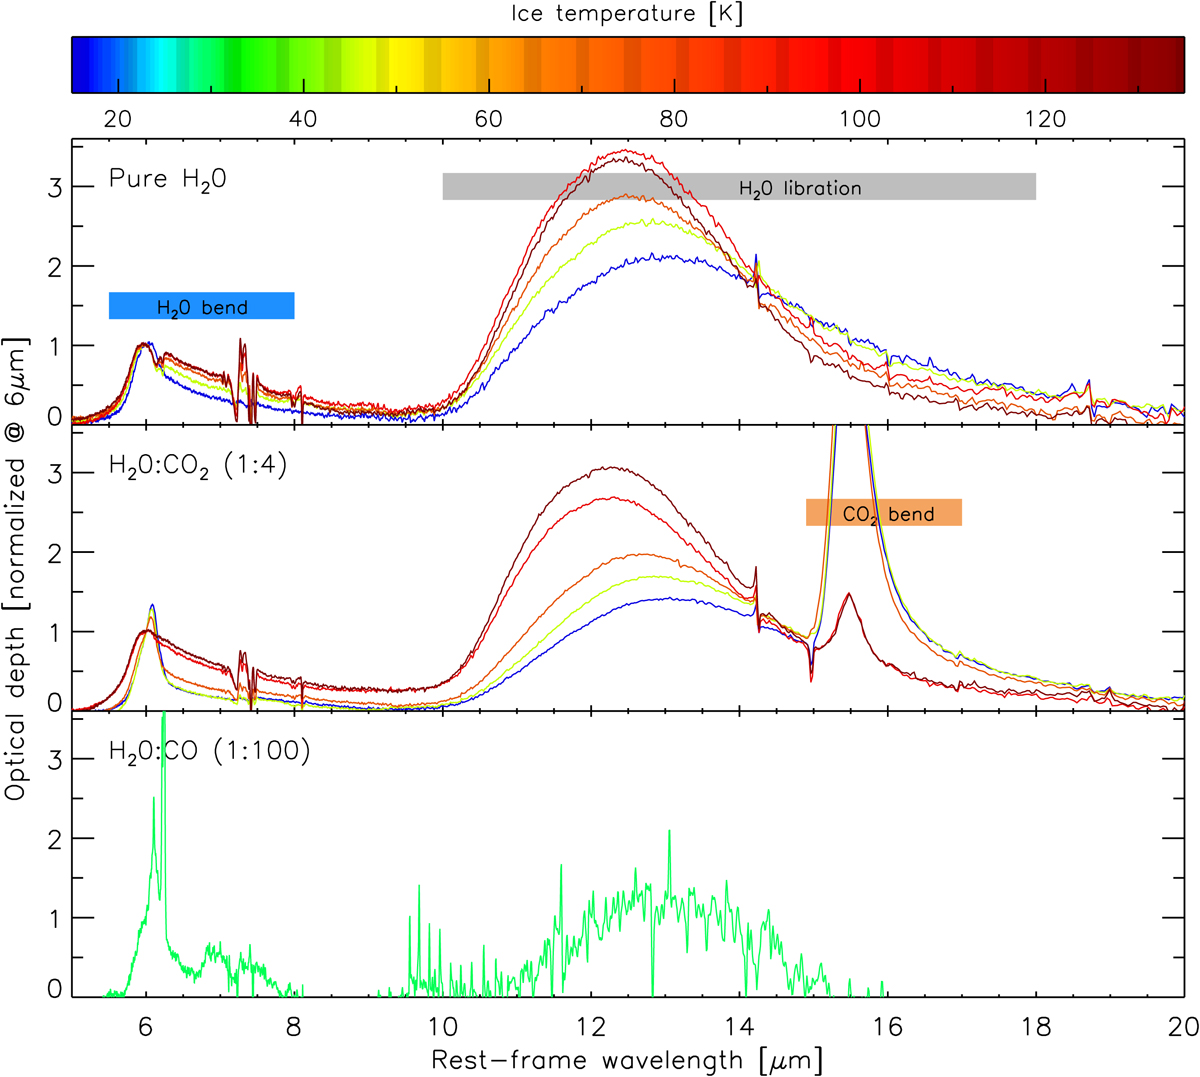
Laboratory measurements of the water ice optical depth as a function of temperature. Top panel: Pure water. Middle panel: Water and CO2 mix (1:4). Bottom panel: Water CO mix (1:100). The laboratory data are from Ehrenfreund et al. (1997) and Öberg et al. (2007) (see Fig. 29 in Spoon et al. 2022 for a similar plot).
Current usage metrics show cumulative count of Article Views (full-text article views including HTML views, PDF and ePub downloads, according to the available data) and Abstracts Views on Vision4Press platform.
Data correspond to usage on the plateform after 2015. The current usage metrics is available 48-96 hours after online publication and is updated daily on week days.
Initial download of the metrics may take a while.