Fig. 8
Download original image
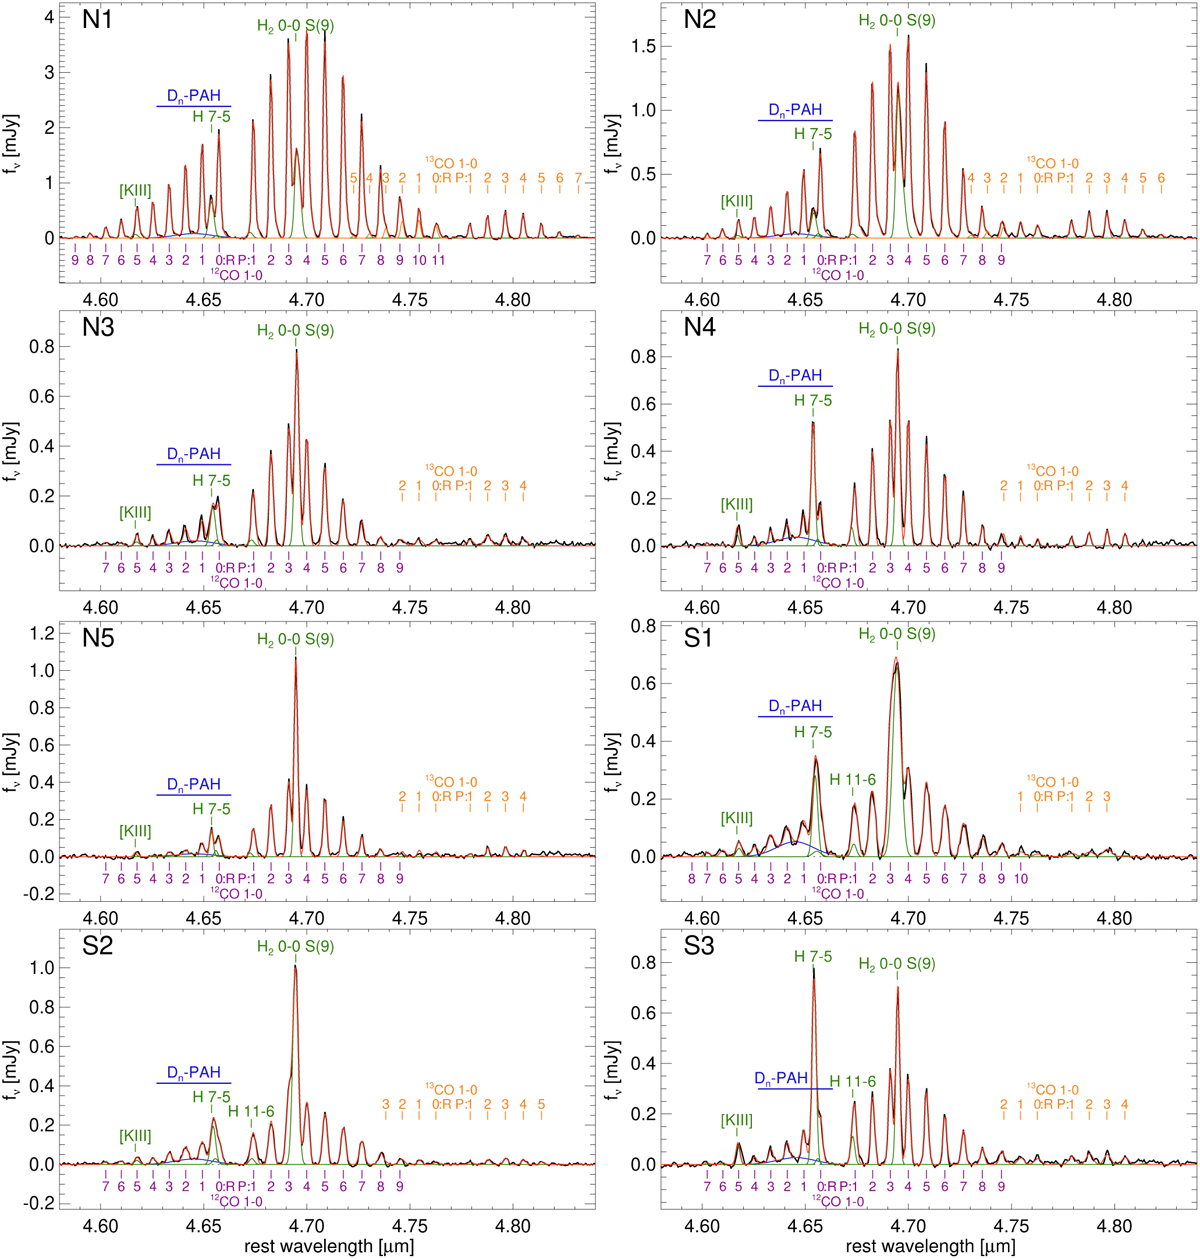
Continuum-subtracted spectra (black line) of the selected regions (see Sect. 3.3 and bottom right panel of Fig. 1) where the CO v = 1−0 band is detected in emission. The red line is the best-fit model. The 13CO and C18O emission lines are fitted and subtracted (see Sect. 3.3.2) before fitting the remaining spectral features. The green, blue, and orange lines, which are also included in the best fit, represent the atomic and molecular transitions, the Dn-PAH feature, and the 13CO v = 1−0 band, respectively. The wavelengths of the 12CO v = 1−0 transitions are indicated in purple. All the spectral features present in the best-fit model are listed in Table 1.
Current usage metrics show cumulative count of Article Views (full-text article views including HTML views, PDF and ePub downloads, according to the available data) and Abstracts Views on Vision4Press platform.
Data correspond to usage on the plateform after 2015. The current usage metrics is available 48-96 hours after online publication and is updated daily on week days.
Initial download of the metrics may take a while.