Fig. 3
Download original image
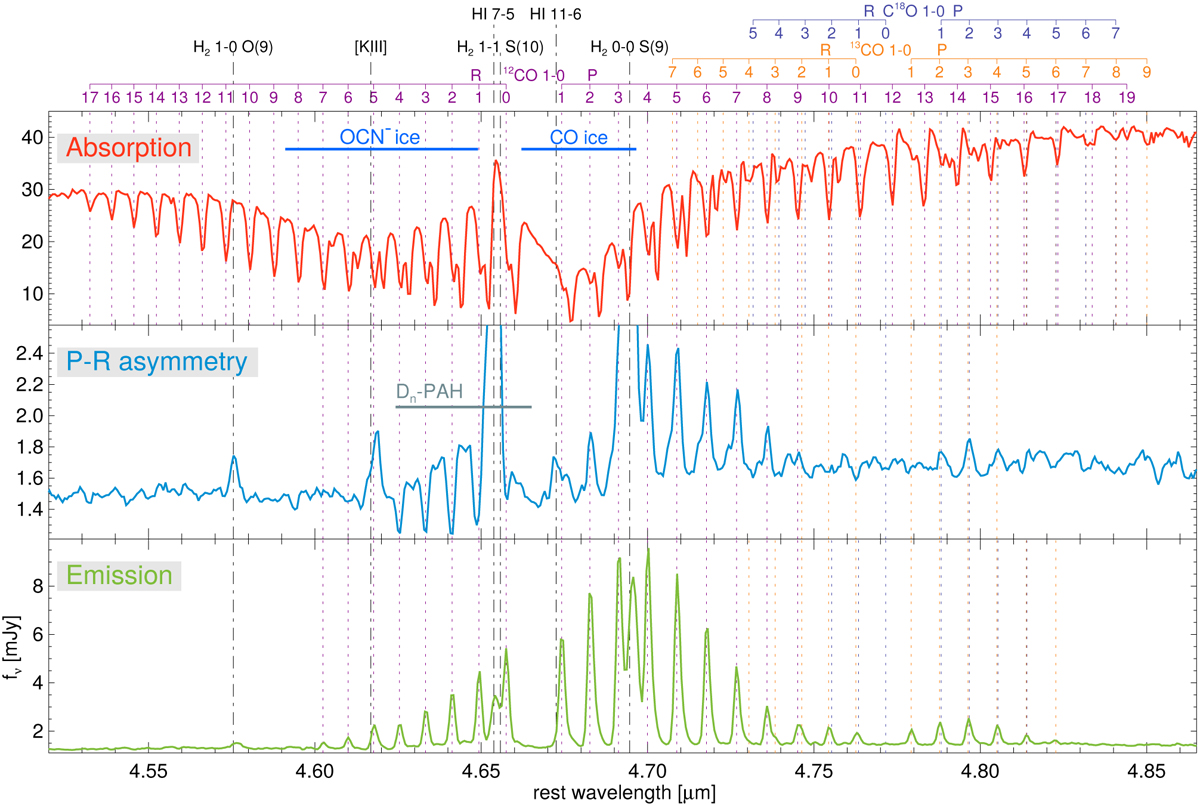
Spectra of the CO υ = 1–0 band from the three classes defined in Sect. 3.2 (see Fig. 5) based on the absorption or emission of the P- and R-branches. The top panel shows the spectrum of the nuclear region where both branches are in absorption. The middle panel is the integrated spectrum of the regions where the R-branch is in absorption and the P-branch is in emission (rotating disk). The bottom panel is the integrated spectrum of areas with both branches in emission (outflow region perpendicular to the disk). The wavelengths of the P- and R-branches of the 12CO, 13CO, and C18O υ = 1–0 bands are marked by the dashed purple, orange, and blue lines, respectively. Transitions from other atomic and molecular species are marked by the dot-dashed black lines. The Dn-PAH band and the OCN− and CO ices are indicated in the middle and top panels. The rest frame is defined using the wavelength of the higher-J CO υ = 1–0 transitions detected, which for the nucleus are blueshifted with respect to the systemic velocity.
Current usage metrics show cumulative count of Article Views (full-text article views including HTML views, PDF and ePub downloads, according to the available data) and Abstracts Views on Vision4Press platform.
Data correspond to usage on the plateform after 2015. The current usage metrics is available 48-96 hours after online publication and is updated daily on week days.
Initial download of the metrics may take a while.