Fig. 10
Download original image
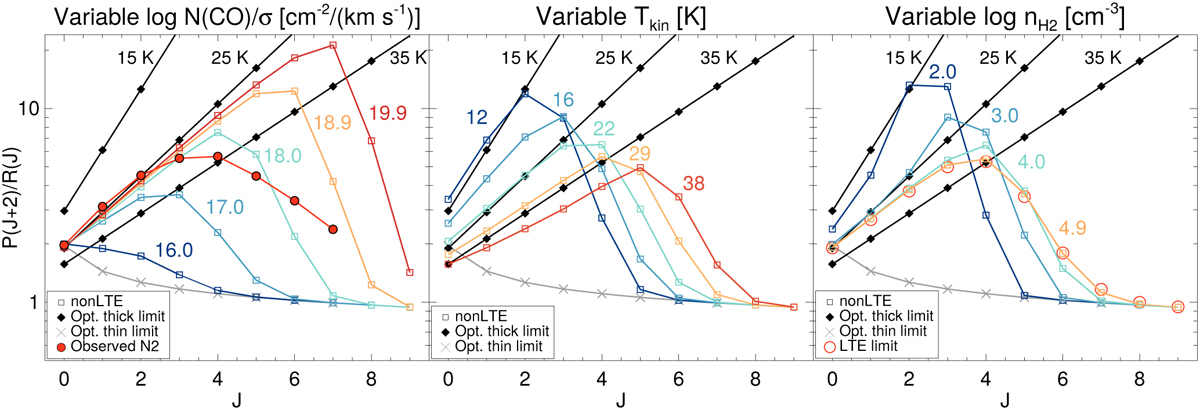
Predicted P(J+2)/R(J) ≡ fJ ratios for the 12CO v = 1−0 band. The optically thin limit is represented by the gray crosses (Sect. 4.1.1). The black diamonds show the optically thick limit for three rotational temperatures (15, 25, and 35 K; Sect. 4.1.2). The dependence on N(CO)/σv (left panel), Tkin (middle panel), and ![]() (right panel) of the single component NLTE models is indicated by the colored (blue to orange/red) empty squares. Only one parameter is varied in each panel (the colored numbers indicate the value of the varied parameter). The remaining two parameters are constant and equal to the following reference values: N(CO)/σv = 10177 cm−2/(km s−1), Tkin = 25 K, and
(right panel) of the single component NLTE models is indicated by the colored (blue to orange/red) empty squares. Only one parameter is varied in each panel (the colored numbers indicate the value of the varied parameter). The remaining two parameters are constant and equal to the following reference values: N(CO)/σv = 10177 cm−2/(km s−1), Tkin = 25 K, and ![]() (see Sect. 4.1.3). The red filled circles in the left panel are the observed ratios in region N2. The red empty circles in the right panel represent the LTE limit for the reference values of Tkin and N(CO)/σv. The points are connected by lines to guide the eye.
(see Sect. 4.1.3). The red filled circles in the left panel are the observed ratios in region N2. The red empty circles in the right panel represent the LTE limit for the reference values of Tkin and N(CO)/σv. The points are connected by lines to guide the eye.
Current usage metrics show cumulative count of Article Views (full-text article views including HTML views, PDF and ePub downloads, according to the available data) and Abstracts Views on Vision4Press platform.
Data correspond to usage on the plateform after 2015. The current usage metrics is available 48-96 hours after online publication and is updated daily on week days.
Initial download of the metrics may take a while.