Fig. 1
Download original image
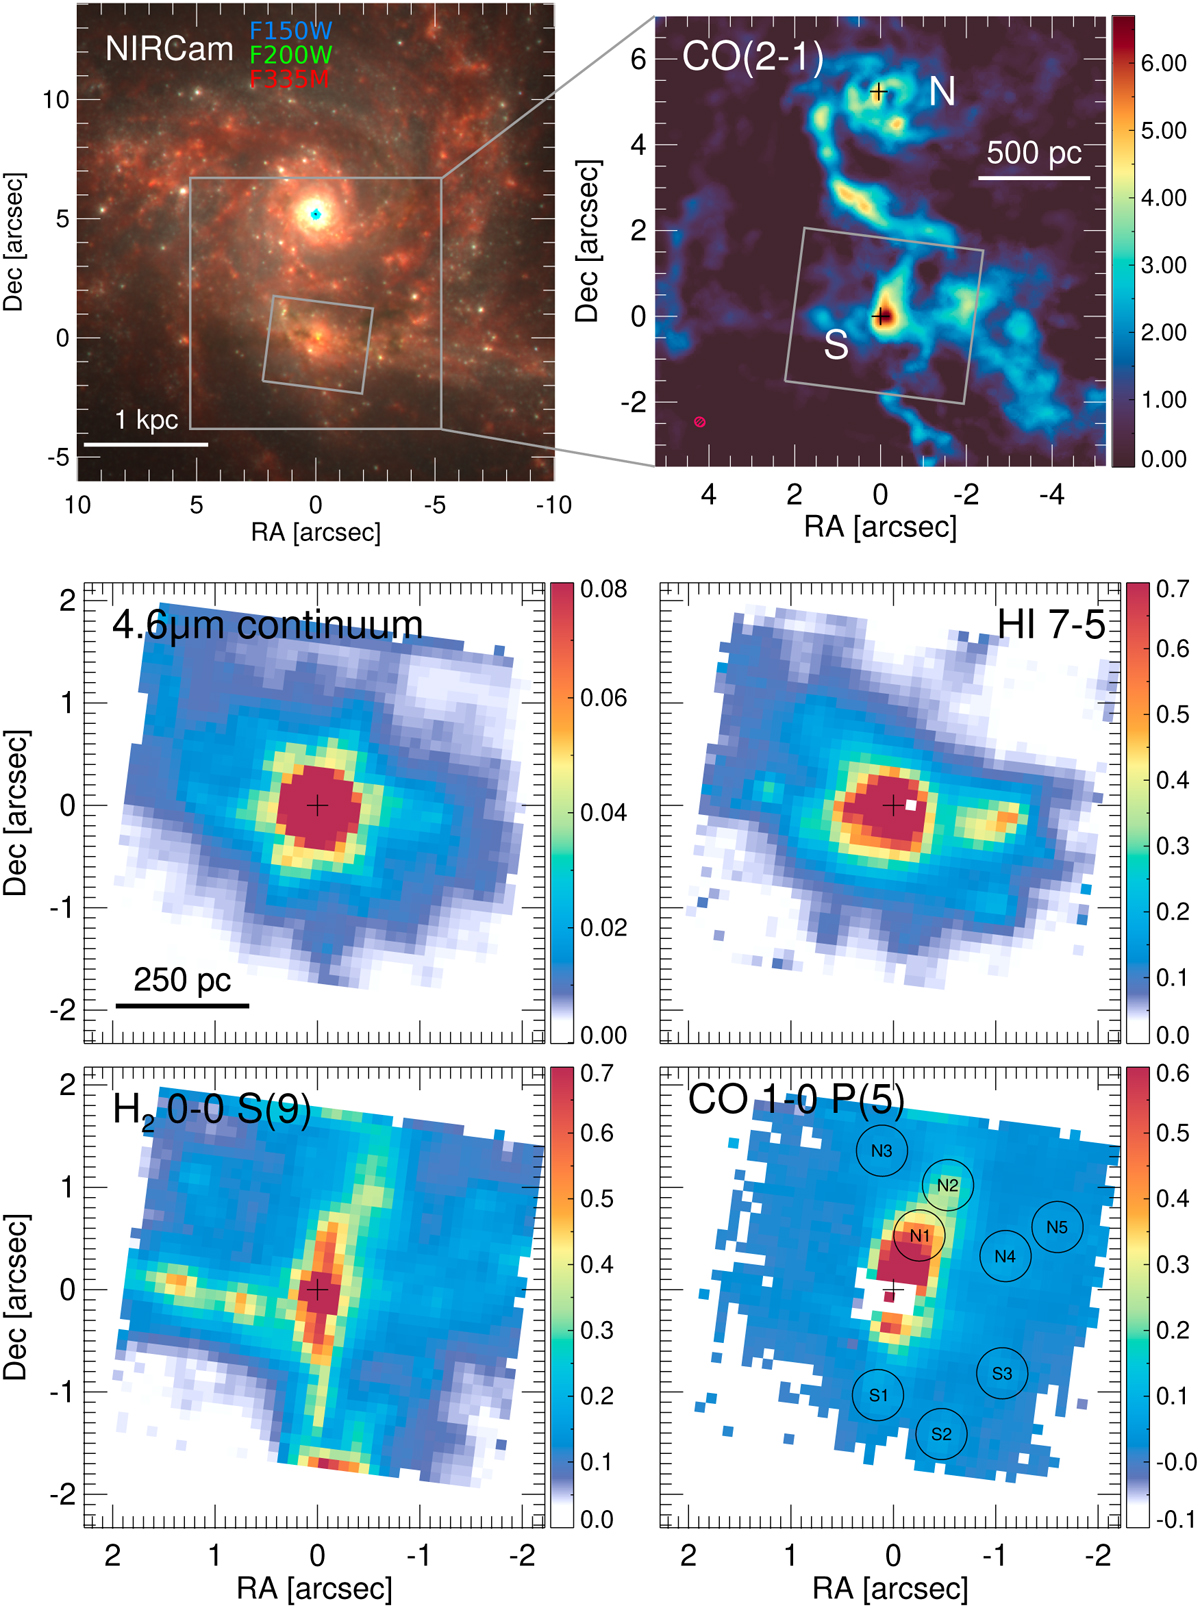
JWST and ALMA maps of NGC 3256. Top-left: color image of NGC 3256 combining the NIRCam filters F150W (blue), F200W (green), and F335M (red). The latter contains the PAH3.3 µm band. The gray box marks the field of view of the ALMA CO(2–1) map (top-right panel) and the tilted gray rectangle is the NIRSpec field of view (middle and bottom row panels). Top-right: ALMA CO(2–1) 230.54 GHz zeroth moment map. The red ellipse represents the beam FWHM (0″.39 × 0″.37). The units of the image are Jy kms−1 beam−1. The crosses mark the northern and southern nuclei of NGC 3256 based on the 235 GHz continuum. Middle-left: NIRSpec 4.6 µm continuum map (see Sect. 3.1). The units are mJy pixel−1. Middle-right, bottom-left, and bottom-right: maps of the HI 7–5 4.65 µm, H2 0–0 S(9) 4.69 µm, and CO υ = 1–0 P(5) 4.71 µm transitions, respectively (see Sect. 3.1). The maps are in units of 10−16 erg s−1 cm−2 pixel−1. The crosses indicate the nuclear position determined from the 4.6 µm continuum peak. The circular apertures in the last panel are the regions used to extract the spectra of individual regions (Sect. 3.3).
Current usage metrics show cumulative count of Article Views (full-text article views including HTML views, PDF and ePub downloads, according to the available data) and Abstracts Views on Vision4Press platform.
Data correspond to usage on the plateform after 2015. The current usage metrics is available 48-96 hours after online publication and is updated daily on week days.
Initial download of the metrics may take a while.