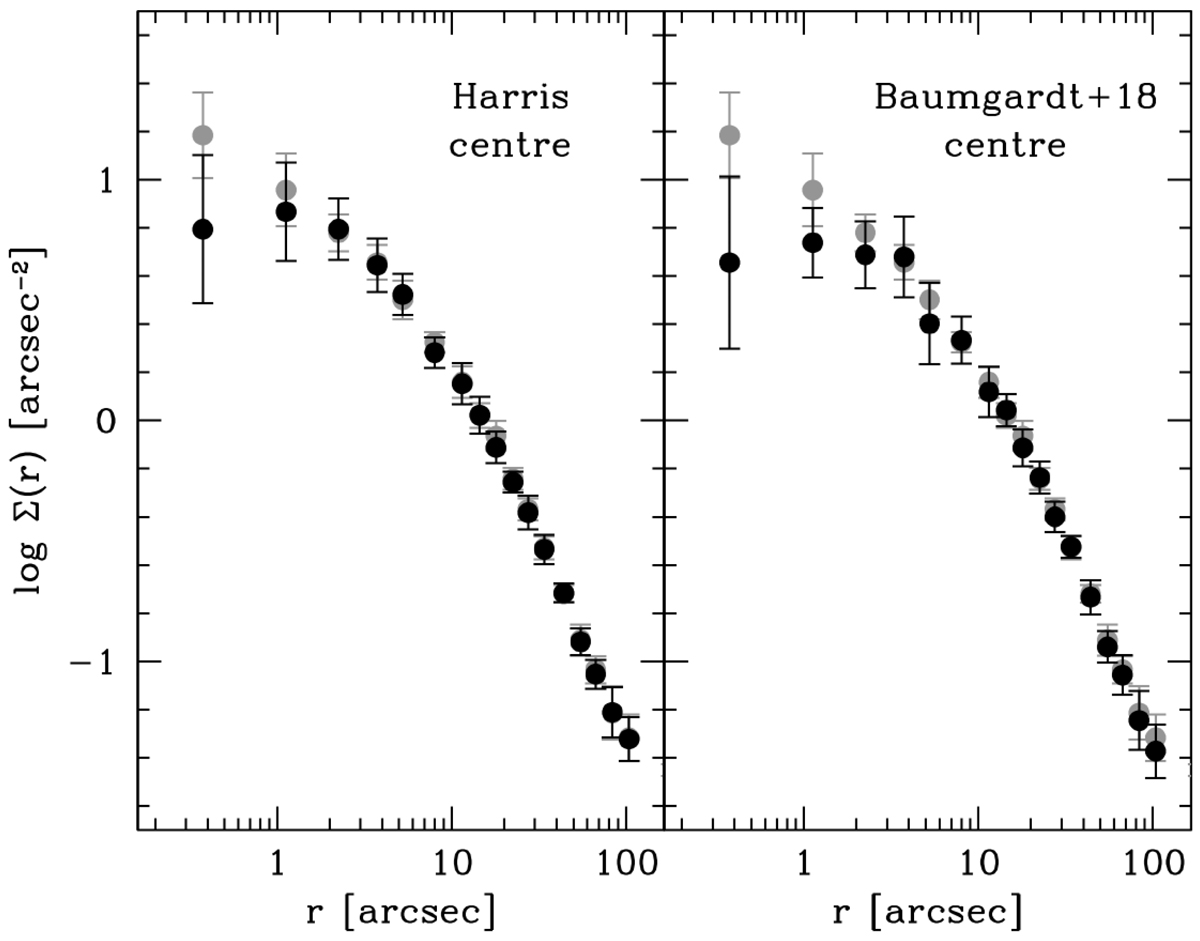
Fig. 3.
Download original image
Density profile obtained in this work, calculated with respect to the value of Cgrav quoted in Sect. 3.1, is shown with grey circles (same as the empty circles in Fig. 2). Left and right panels show the projected density profile calculated with respect to the cluster centres quoted in the Harris (1996) catalogue and in Baumgardt & Hilker (2018), respectively (black circles). Only the inner portion of the profile, out to r ∼ 100″, is shown in the figure.
Current usage metrics show cumulative count of Article Views (full-text article views including HTML views, PDF and ePub downloads, according to the available data) and Abstracts Views on Vision4Press platform.
Data correspond to usage on the plateform after 2015. The current usage metrics is available 48-96 hours after online publication and is updated daily on week days.
Initial download of the metrics may take a while.