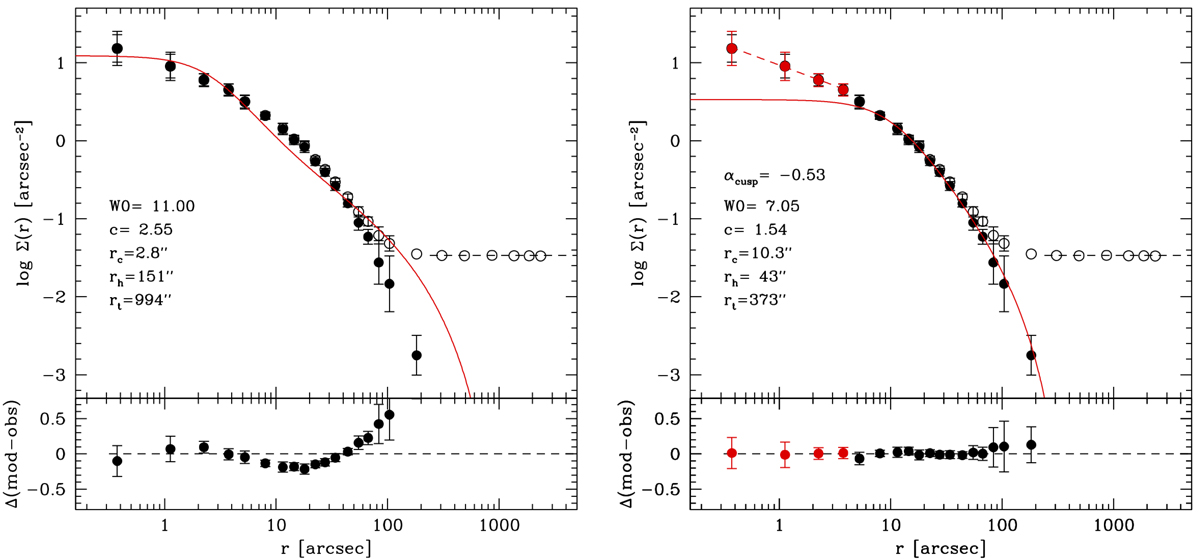
Fig. 2.
Download original image
Star density profile of NGC 6284. The left panel shows the observed profile (empty circles) and the background-subtracted profile (filled circles). The dashed horizontal line is the background density value used to decontaminate the cluster profile from the Galactic field contribution. The solid red curve is the King model that best fits the innermost portion of the profile, obtained for illustrative purposes by artificially increasing the errors of the outer points. The corresponding values of some structural parameters are labelled. The bottom panel shows the residuals between the best-fit King model and the cluster density profile. In the right panel, the circles are the same as in the left panel, but the four innermost points are coloured in red to highlight the presence of a central density cusp. These have been fitted with the power-law function shown as a red dashed line, with slope αcusp = −0.53. The best-fit King model to the profile beyond the four inner points (black solid circles) is shown with the red solid curve, and is characterised by the labelled structural parameters.
Current usage metrics show cumulative count of Article Views (full-text article views including HTML views, PDF and ePub downloads, according to the available data) and Abstracts Views on Vision4Press platform.
Data correspond to usage on the plateform after 2015. The current usage metrics is available 48-96 hours after online publication and is updated daily on week days.
Initial download of the metrics may take a while.