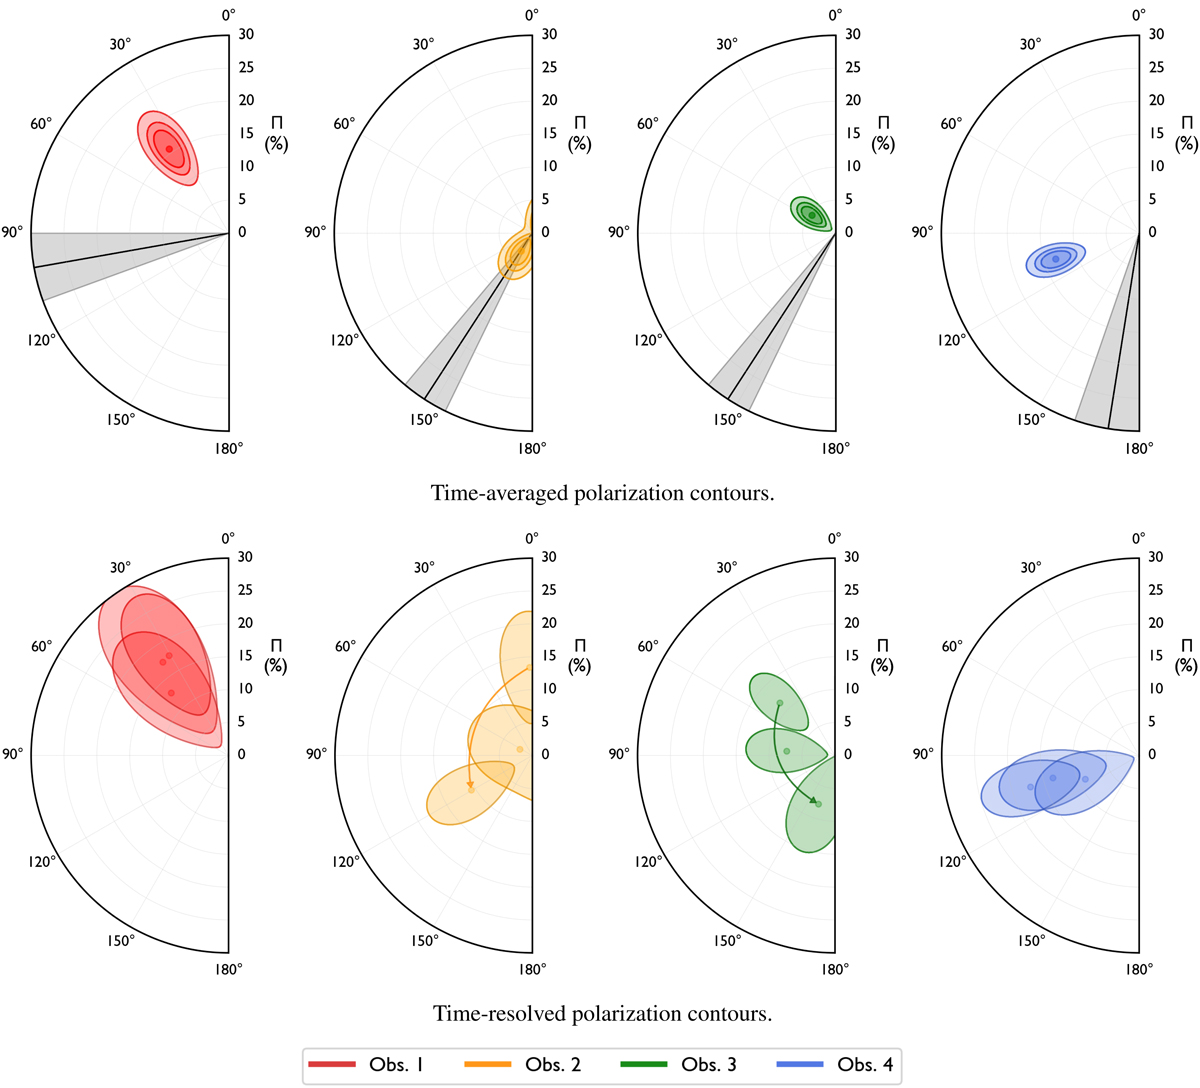
Fig. 5.

Download original image
Time-averaged and time-resolved polarization contours of four multiple IXPE observations. In the top panel, each colored contour represents the significance of the time-averaged polarization detection for the corresponding observation (Obs. 1 in red, Obs. 2 in orange, Obs. 3 in green, and Obs. 4 in blue). Contours are shown at confidence levels of 68.27%, 90.00%, and 99.00%, as determined from a χ2 test with two degrees of freedom. Additionally, the black line and gray shaded areas indicate the jet’s electric-vector position angle in degrees as observed by the VLBA at 43 GHz (Obs. 1 is 100 ± 10°, Obs. 2 is 147 ± 7°, Obs. 3 is 147 ± 7°, and Obs. 4 is 171 ± 10°). In the bottom panel, the 99.00% confidence level contours show the time variation in polarization properties as determined by dividing the data into three identical time intervals for each observation. In the cases of Obs. 2 (orange) and Obs. 3 (green), arrows indicate a rotation of ψX from the start to the end of the observation.
Current usage metrics show cumulative count of Article Views (full-text article views including HTML views, PDF and ePub downloads, according to the available data) and Abstracts Views on Vision4Press platform.
Data correspond to usage on the plateform after 2015. The current usage metrics is available 48-96 hours after online publication and is updated daily on week days.
Initial download of the metrics may take a while.


