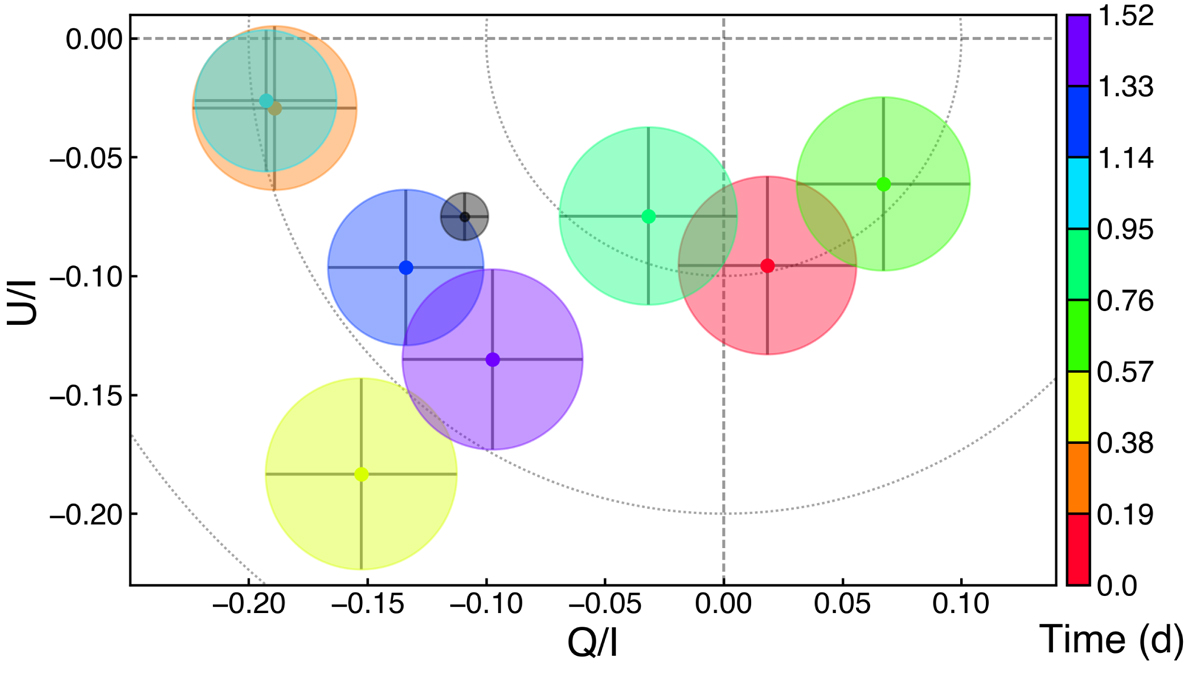
Fig. 4.
Download original image
Time variability of the 𝒬 and 𝒰 Stokes parameters during Obs. 4. Each circle indicates the 1σ uncertainties of eight identical time intervals, derived using an event-based ML technique as described in Di Gesu et al. (2023). The black circle shows the time-averaged polarization. Each color represents a time interval from the start to the end of Obs. 4.
Current usage metrics show cumulative count of Article Views (full-text article views including HTML views, PDF and ePub downloads, according to the available data) and Abstracts Views on Vision4Press platform.
Data correspond to usage on the plateform after 2015. The current usage metrics is available 48-96 hours after online publication and is updated daily on week days.
Initial download of the metrics may take a while.