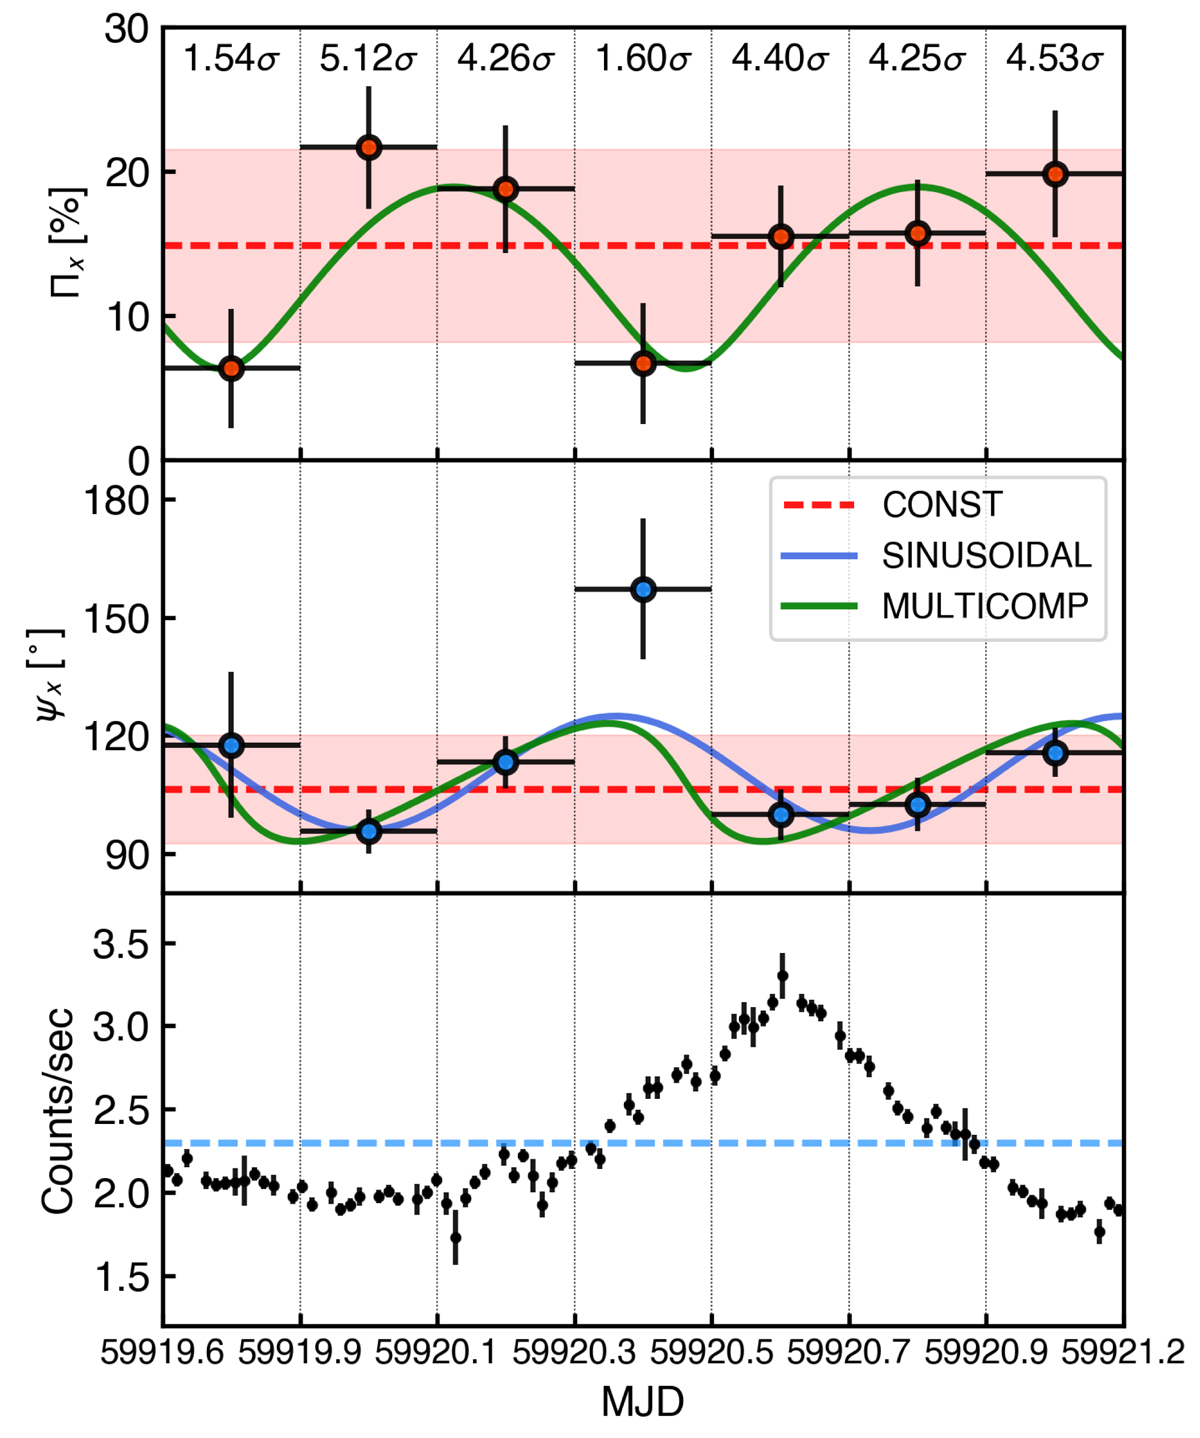
Fig. 3.
Download original image
IXPE polarization and photon counts versus time during Obs. 4. From top to bottom: ΠX, ψX, and count rates. Polarization results are from a time-resolved analysis with seven identical 19 ks time bins. The detection significance for each bin is displayed at the top of the figure. In the ΠX and ψX panels, dashed red lines denote a fit to a constant function; the shaded area corresponds to ≤3σ uncertainty. In addition, the solid blue and green lines indicate the best-fit result with the sinusoidal and multicomponent model, respectively. The dashed blue line in the light curve indicates the average value during the observation.
Current usage metrics show cumulative count of Article Views (full-text article views including HTML views, PDF and ePub downloads, according to the available data) and Abstracts Views on Vision4Press platform.
Data correspond to usage on the plateform after 2015. The current usage metrics is available 48-96 hours after online publication and is updated daily on week days.
Initial download of the metrics may take a while.