Fig. 1.
Download original image
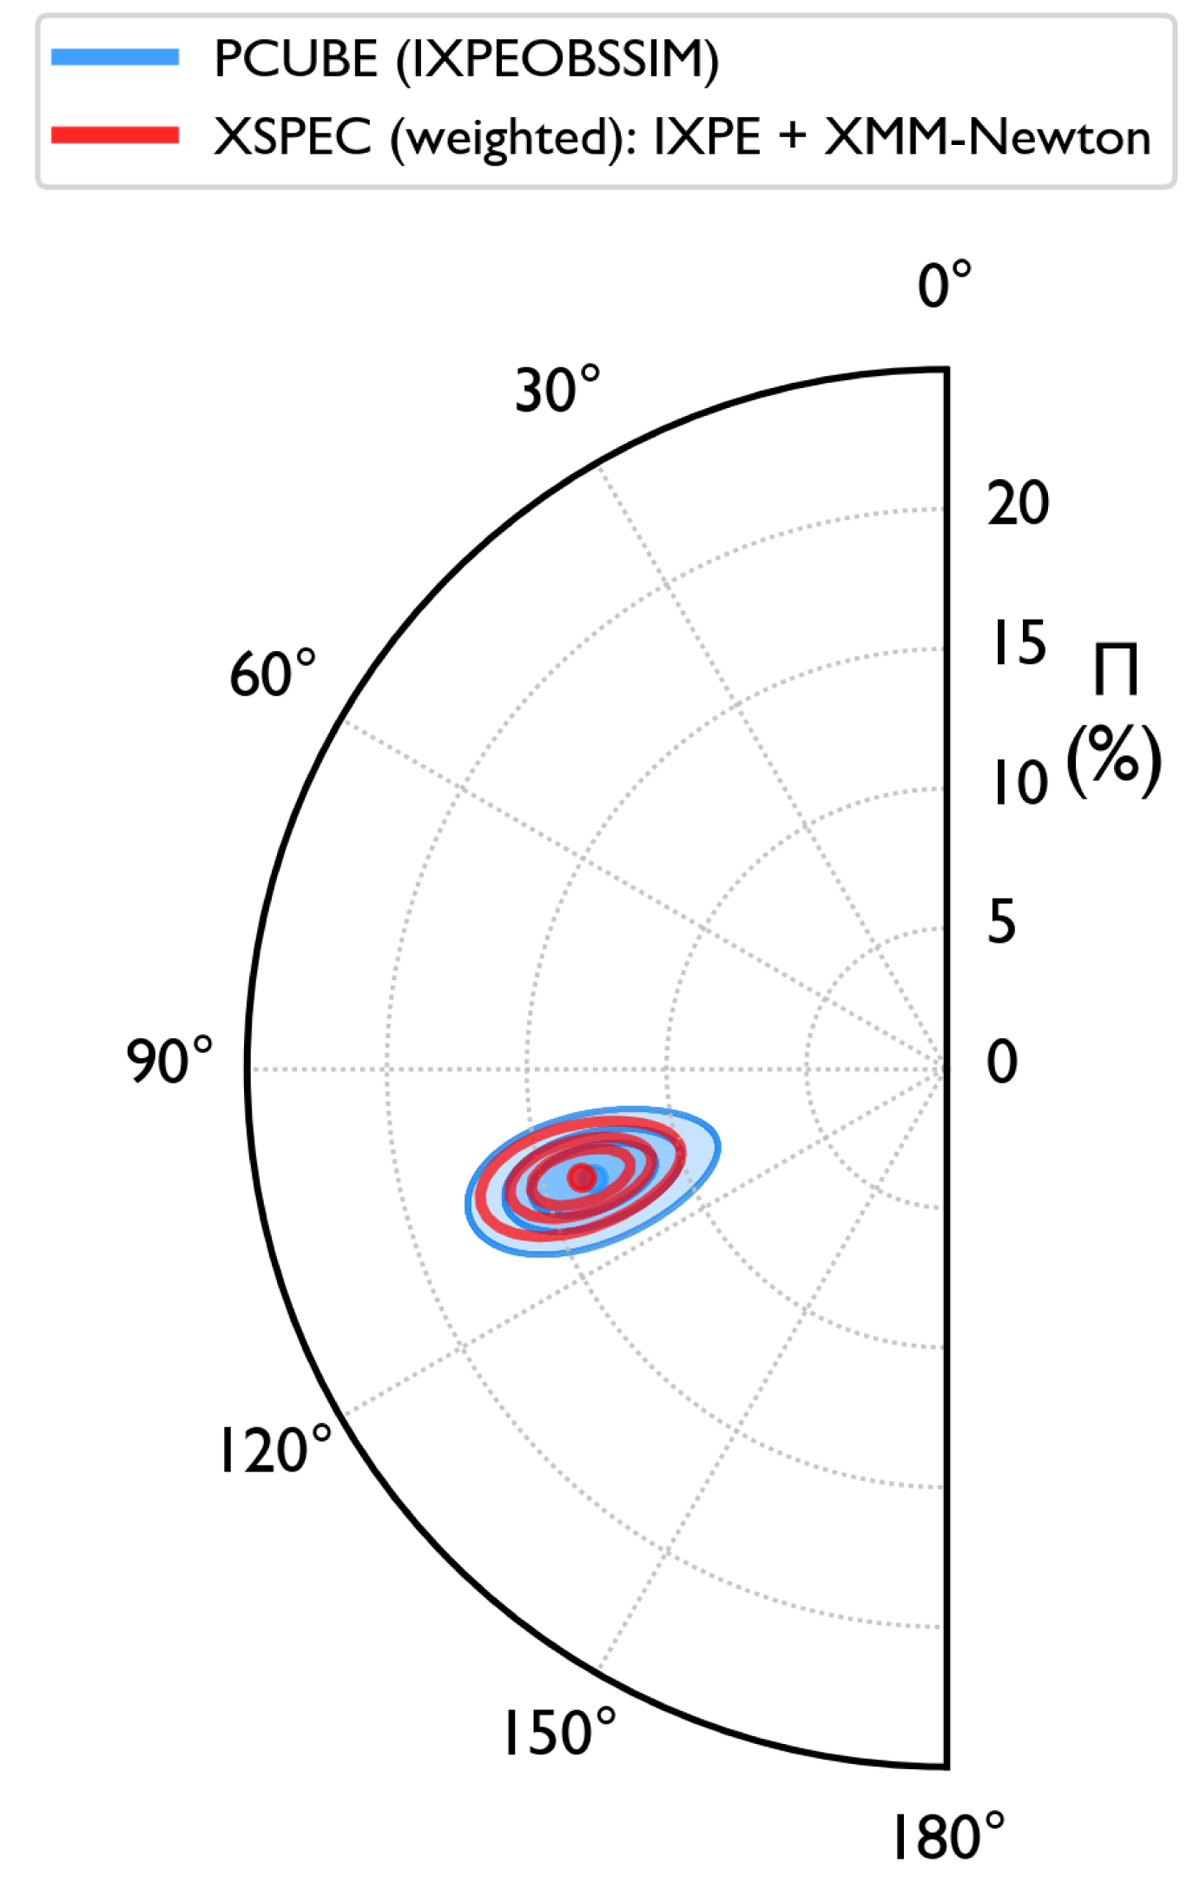
Polarization contours from Obs. 4. Contours represent the significance of the time-averaged polarization detected with confidence levels of 68.27%, 90.00%, and 99.00%, with two degrees of freedom. The blue contour indicates the values of ΠX and ψX derived via the PCUBE methods, and the red contours show the same properties from simultaneous IXPE and XMM-Newton spectropolarimetric analysis. The radial and angular values represent ΠX and ψX, respectively, with the latter measured from north through east.
Current usage metrics show cumulative count of Article Views (full-text article views including HTML views, PDF and ePub downloads, according to the available data) and Abstracts Views on Vision4Press platform.
Data correspond to usage on the plateform after 2015. The current usage metrics is available 48-96 hours after online publication and is updated daily on week days.
Initial download of the metrics may take a while.