Open Access
Fig. 2
Download original image
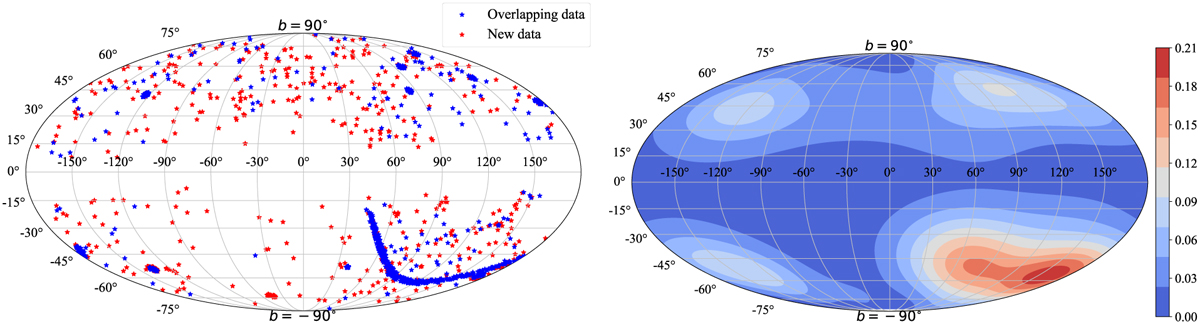
Distribution and corresponding density contour in the galactic coordinate system. Left panel shows the SNe distribution of the Pantheon sample. Red and blue points represent the new added SNe and the SNe where the Pantheon sample and the Pan sample overlap, respectively. Right panel shows the corresponding density contour.
Current usage metrics show cumulative count of Article Views (full-text article views including HTML views, PDF and ePub downloads, according to the available data) and Abstracts Views on Vision4Press platform.
Data correspond to usage on the plateform after 2015. The current usage metrics is available 48-96 hours after online publication and is updated daily on week days.
Initial download of the metrics may take a while.