Fig. 13
Download original image
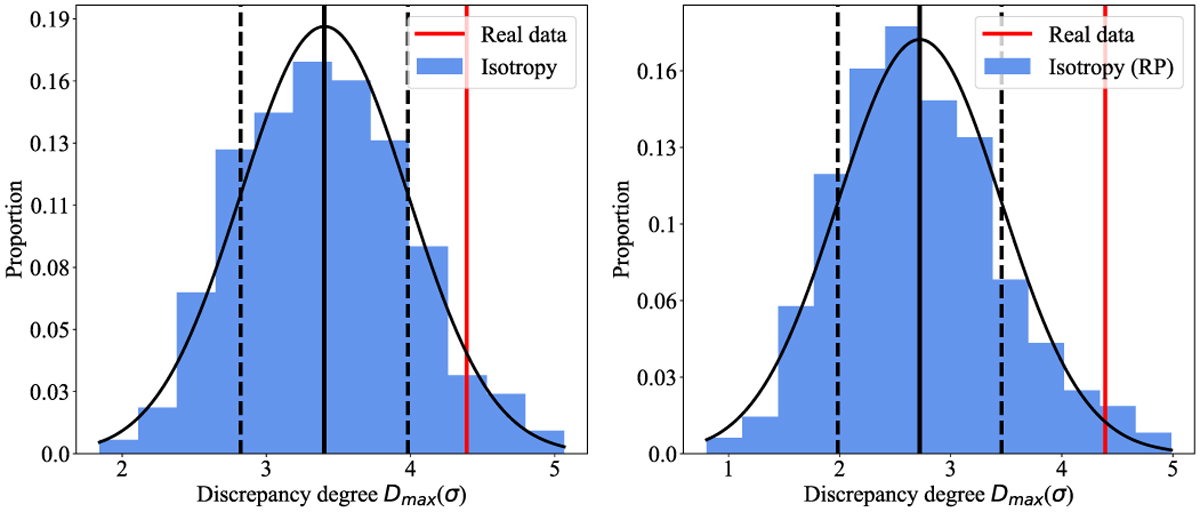
Distribution of discrepancy degree Dmax obtained from H0 distribution in 500 simulated isotropic datasets. The left panel and right panel show the results of isotropy and isotropy RP analyses, respectively. The black curve is the best fit to the Gaussian function. The solid black and vertical dashed lines are commensurate with the mean and the standard deviation, respectively. The red lines represent the discrepancy degree from the real data. The statistical significances of the real data are 1.70σ for the isotropy analysis and 2.27σ for the isotropy RP analysis.
Current usage metrics show cumulative count of Article Views (full-text article views including HTML views, PDF and ePub downloads, according to the available data) and Abstracts Views on Vision4Press platform.
Data correspond to usage on the plateform after 2015. The current usage metrics is available 48-96 hours after online publication and is updated daily on week days.
Initial download of the metrics may take a while.