Fig. 9
Download original image
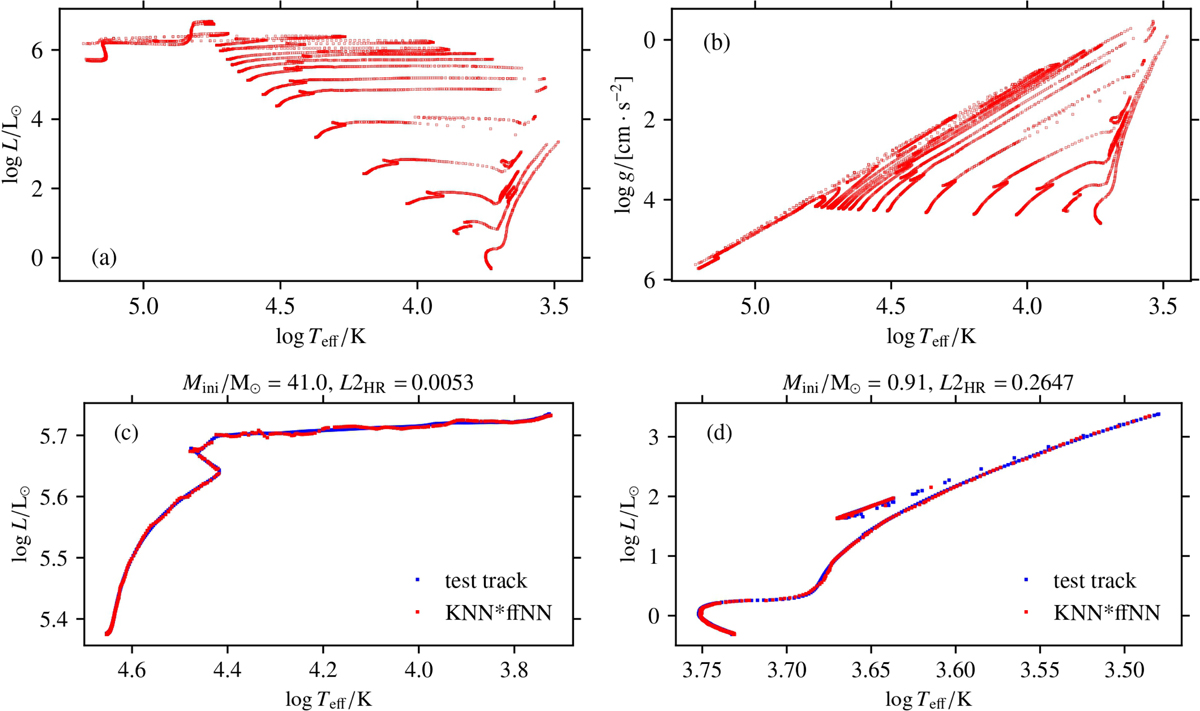
Outcome of the two-step interpolation scheme with supervised ML. Stellar tracks in the HR (top left) and Kiel diagram (top right) for unseen test initial masses are predicted as function of age τ. For comparison with the true test HR and Kiel tracks, see Fig. 4. For better visibility, the best- (bottom left) and worst-fit (bottom right) of tracks in the HR diagram, as assessed by the L2 measurement, are displayed separately.
Current usage metrics show cumulative count of Article Views (full-text article views including HTML views, PDF and ePub downloads, according to the available data) and Abstracts Views on Vision4Press platform.
Data correspond to usage on the plateform after 2015. The current usage metrics is available 48-96 hours after online publication and is updated daily on week days.
Initial download of the metrics may take a while.