Open Access
Fig. 5
Download original image
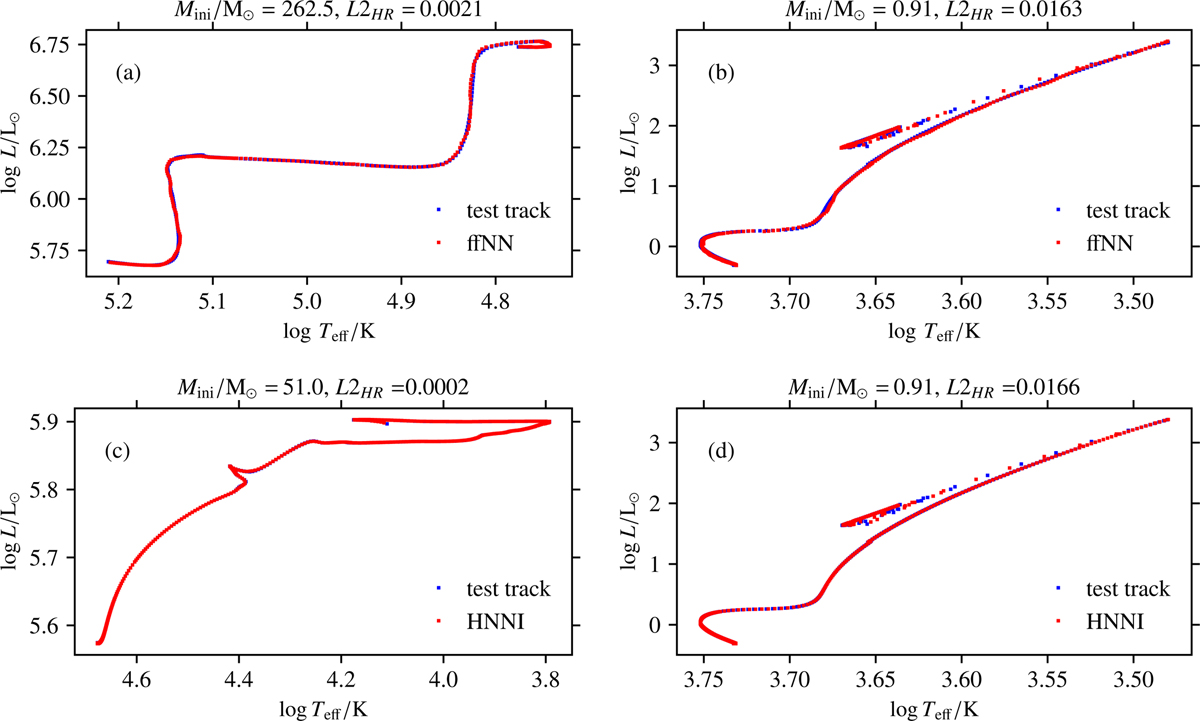
Test data results, showing the best (left) and the worst (right) predictions of stellar evolutionary tracks, as assessed by the L2 measure, in the HR diagram, for unseen test initial masses, by the trained ffNN model (top) and by the HNNI algorithm (bottom). For comparison, the original held-back tracks are underlain.
Current usage metrics show cumulative count of Article Views (full-text article views including HTML views, PDF and ePub downloads, according to the available data) and Abstracts Views on Vision4Press platform.
Data correspond to usage on the plateform after 2015. The current usage metrics is available 48-96 hours after online publication and is updated daily on week days.
Initial download of the metrics may take a while.