Fig. 3
Download original image
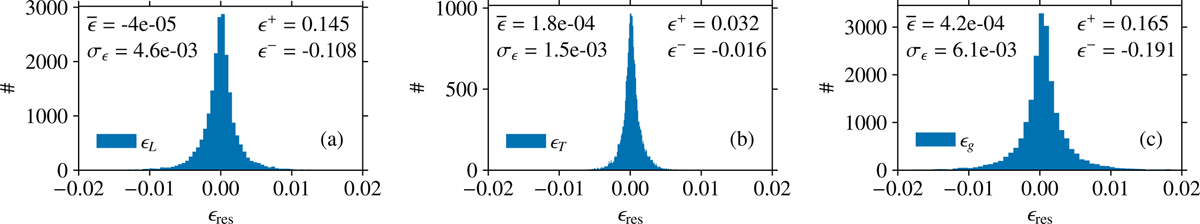
Validation data results for the ffNN-based stellar evolution emulator. The histograms and summary statistics of the residuals ![]() , over the validation data k = 1, …, Nval are shown, for YL in panel a, for YT in panel b, and for Yg in panel c. We calculate the mean
, over the validation data k = 1, …, Nval are shown, for YL in panel a, for YT in panel b, and for Yg in panel c. We calculate the mean ![]() , the standard deviation σϵ, the most extremal underprediction ϵ+, and the most extremal overprediction ϵ−. Overall, the distribution of residuals is globally symmetric around near 0, with a sharper peak than a Gaussian, reminiscent of a Cauchy distribution.
, the standard deviation σϵ, the most extremal underprediction ϵ+, and the most extremal overprediction ϵ−. Overall, the distribution of residuals is globally symmetric around near 0, with a sharper peak than a Gaussian, reminiscent of a Cauchy distribution.
Current usage metrics show cumulative count of Article Views (full-text article views including HTML views, PDF and ePub downloads, according to the available data) and Abstracts Views on Vision4Press platform.
Data correspond to usage on the plateform after 2015. The current usage metrics is available 48-96 hours after online publication and is updated daily on week days.
Initial download of the metrics may take a while.