Fig. A.3
Download original image
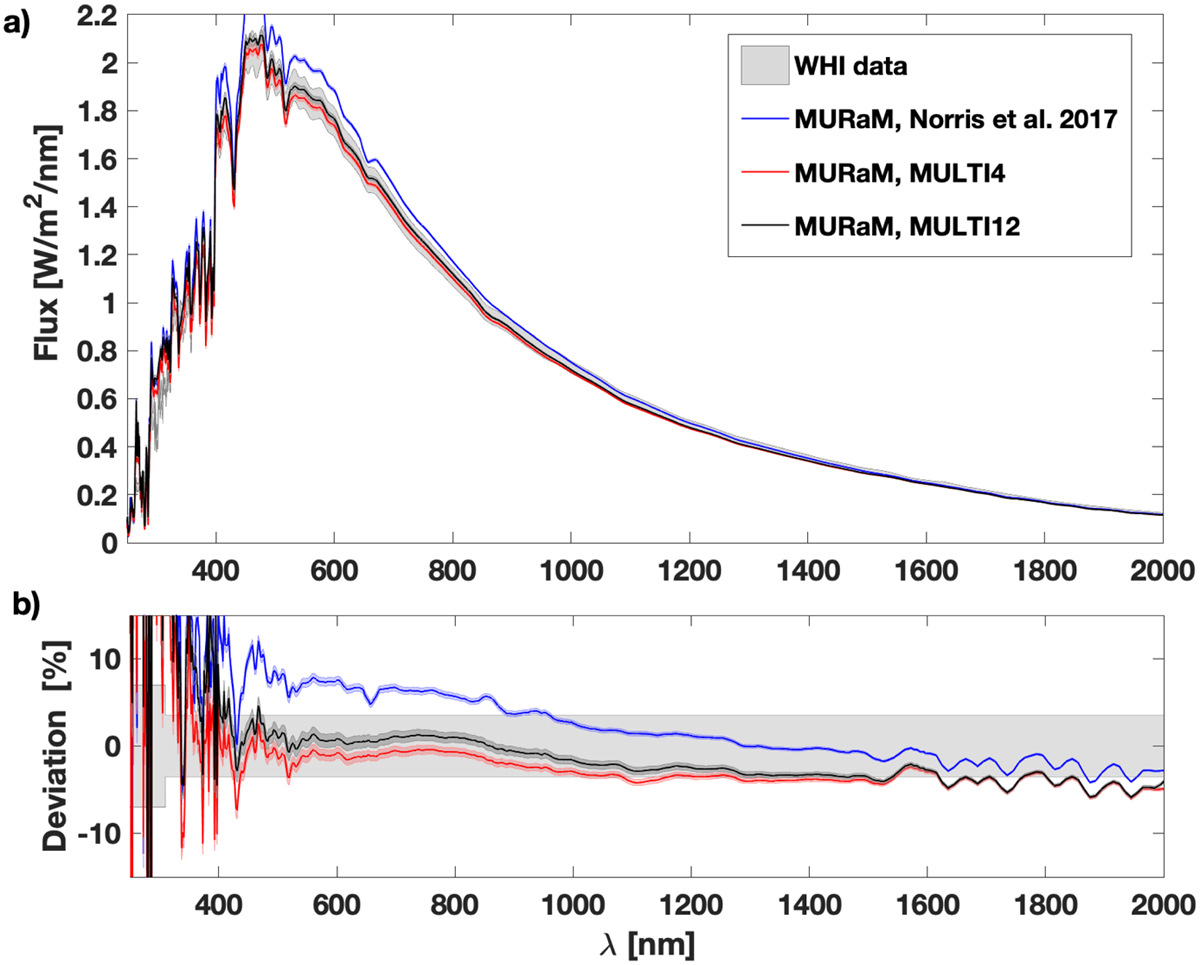
Calculated irradiance spectrum using different versions and setups of the MURaM code together with the measured SIRS WHI solar irradiance spectrum. The grey shaded area indicates the measurement error of the SIRS WHI, as in Fig. 1. The averaged solar irradiance spectrum computed from Beeck2013 cubes is shown in blue; the light blue shaded area indicates one standard deviation in the temporal fluctuations. The red and black lines show the averaged spectrum from cubes simulated with the updated MURaM code version but using different multi-group binning (MULTI4 and MULTI12). The light red and dark grey shaded areas indicate one standard deviation in the temporal fluctuations of these two sets of 3D cubes.
Current usage metrics show cumulative count of Article Views (full-text article views including HTML views, PDF and ePub downloads, according to the available data) and Abstracts Views on Vision4Press platform.
Data correspond to usage on the plateform after 2015. The current usage metrics is available 48-96 hours after online publication and is updated daily on week days.
Initial download of the metrics may take a while.