Fig. 3
Download original image
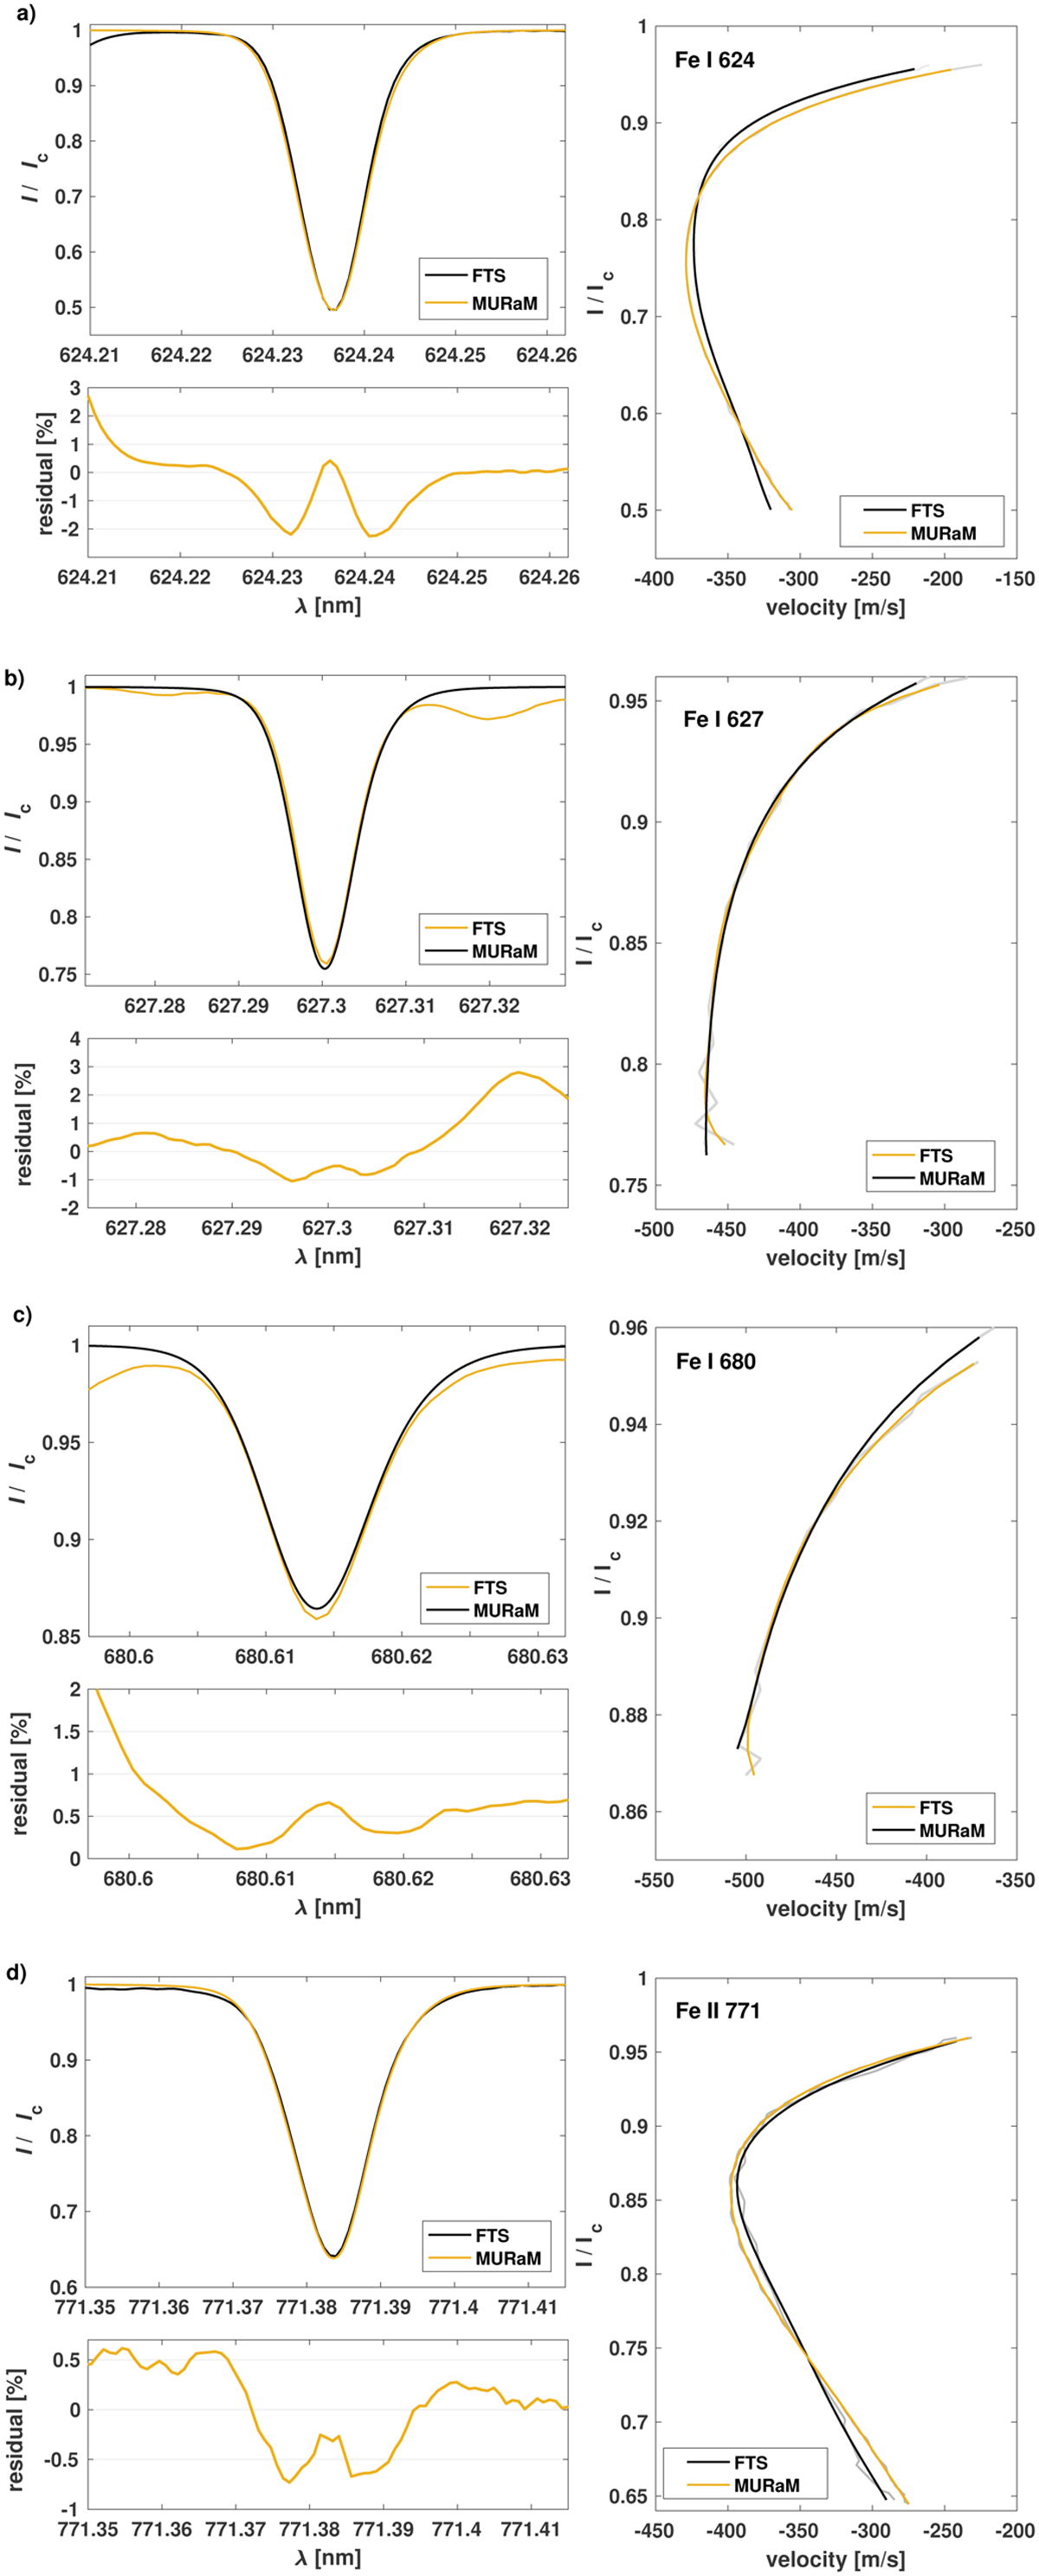
Calculated and observed line profiles, I/Ic (left-top panels), their residuals (as a percentage; left-bottom panels), and the corresponding bisectors (right panels) for four lines. The bisector curves were fitted using a sixth-degree polynomial (black and yellow curves) and the actual data (in gray) are shown. In the individual panels we show the Fe I 624 line (a), the Fe 1627 line (b), the Fe 1680 line (c), and Fe II 771 line (d).
Current usage metrics show cumulative count of Article Views (full-text article views including HTML views, PDF and ePub downloads, according to the available data) and Abstracts Views on Vision4Press platform.
Data correspond to usage on the plateform after 2015. The current usage metrics is available 48-96 hours after online publication and is updated daily on week days.
Initial download of the metrics may take a while.