Fig. 1
Download original image
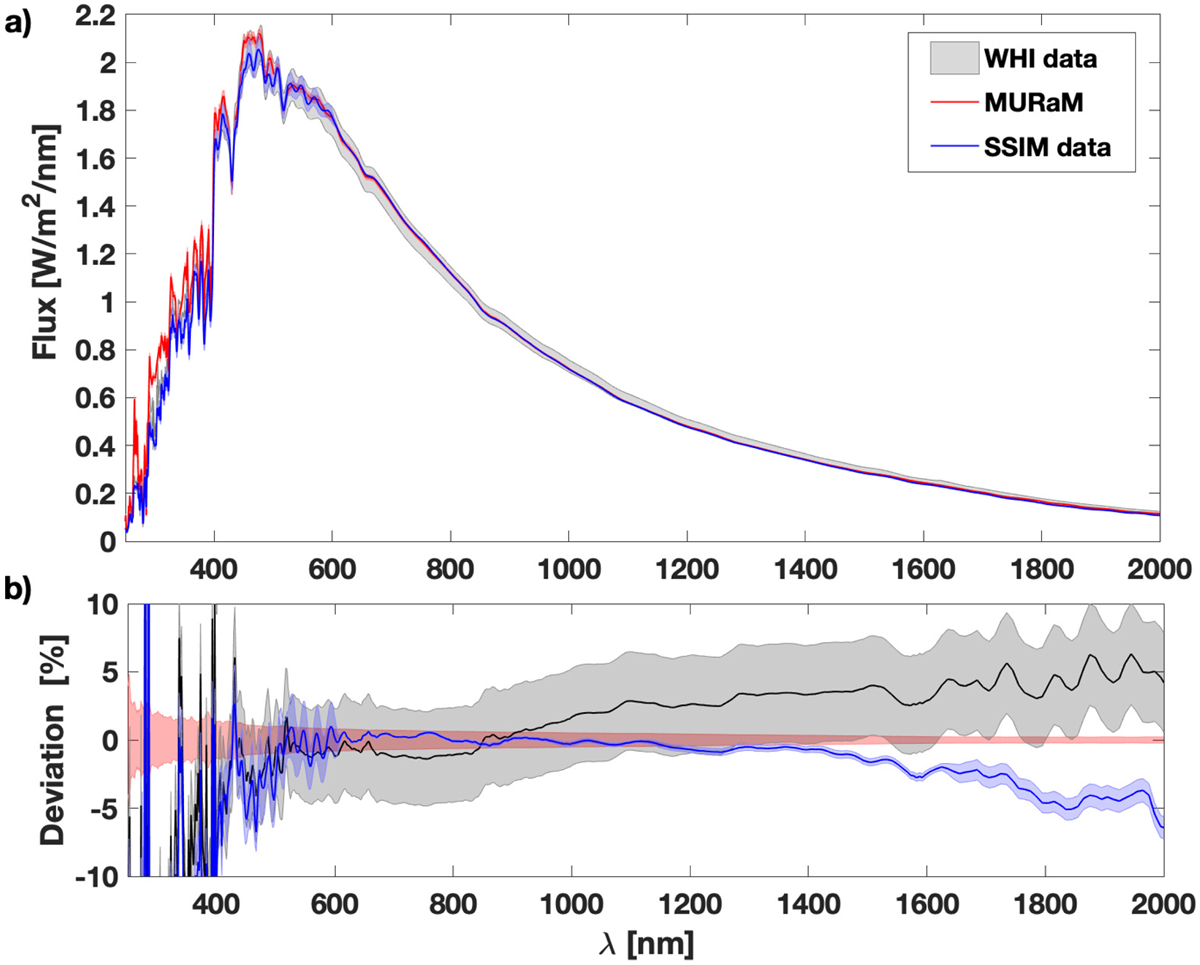
Comparison of the calculated and measured solar irradiance spectrum. The grey shaded area indicates the measurement error of the SIRS for the 2008 WHI (see Woods et al. 2009 for a detailed description). The light blue shaded area indicates one standard deviation of the 145 measurements taken in 2022 by SSIM on board the FY-3E. The averaged solar irradiance spectrum computed from MURaM cubes is represented by the red line; the light red shaded area indicates one standard deviation in the temporal fluctuations.
Current usage metrics show cumulative count of Article Views (full-text article views including HTML views, PDF and ePub downloads, according to the available data) and Abstracts Views on Vision4Press platform.
Data correspond to usage on the plateform after 2015. The current usage metrics is available 48-96 hours after online publication and is updated daily on week days.
Initial download of the metrics may take a while.