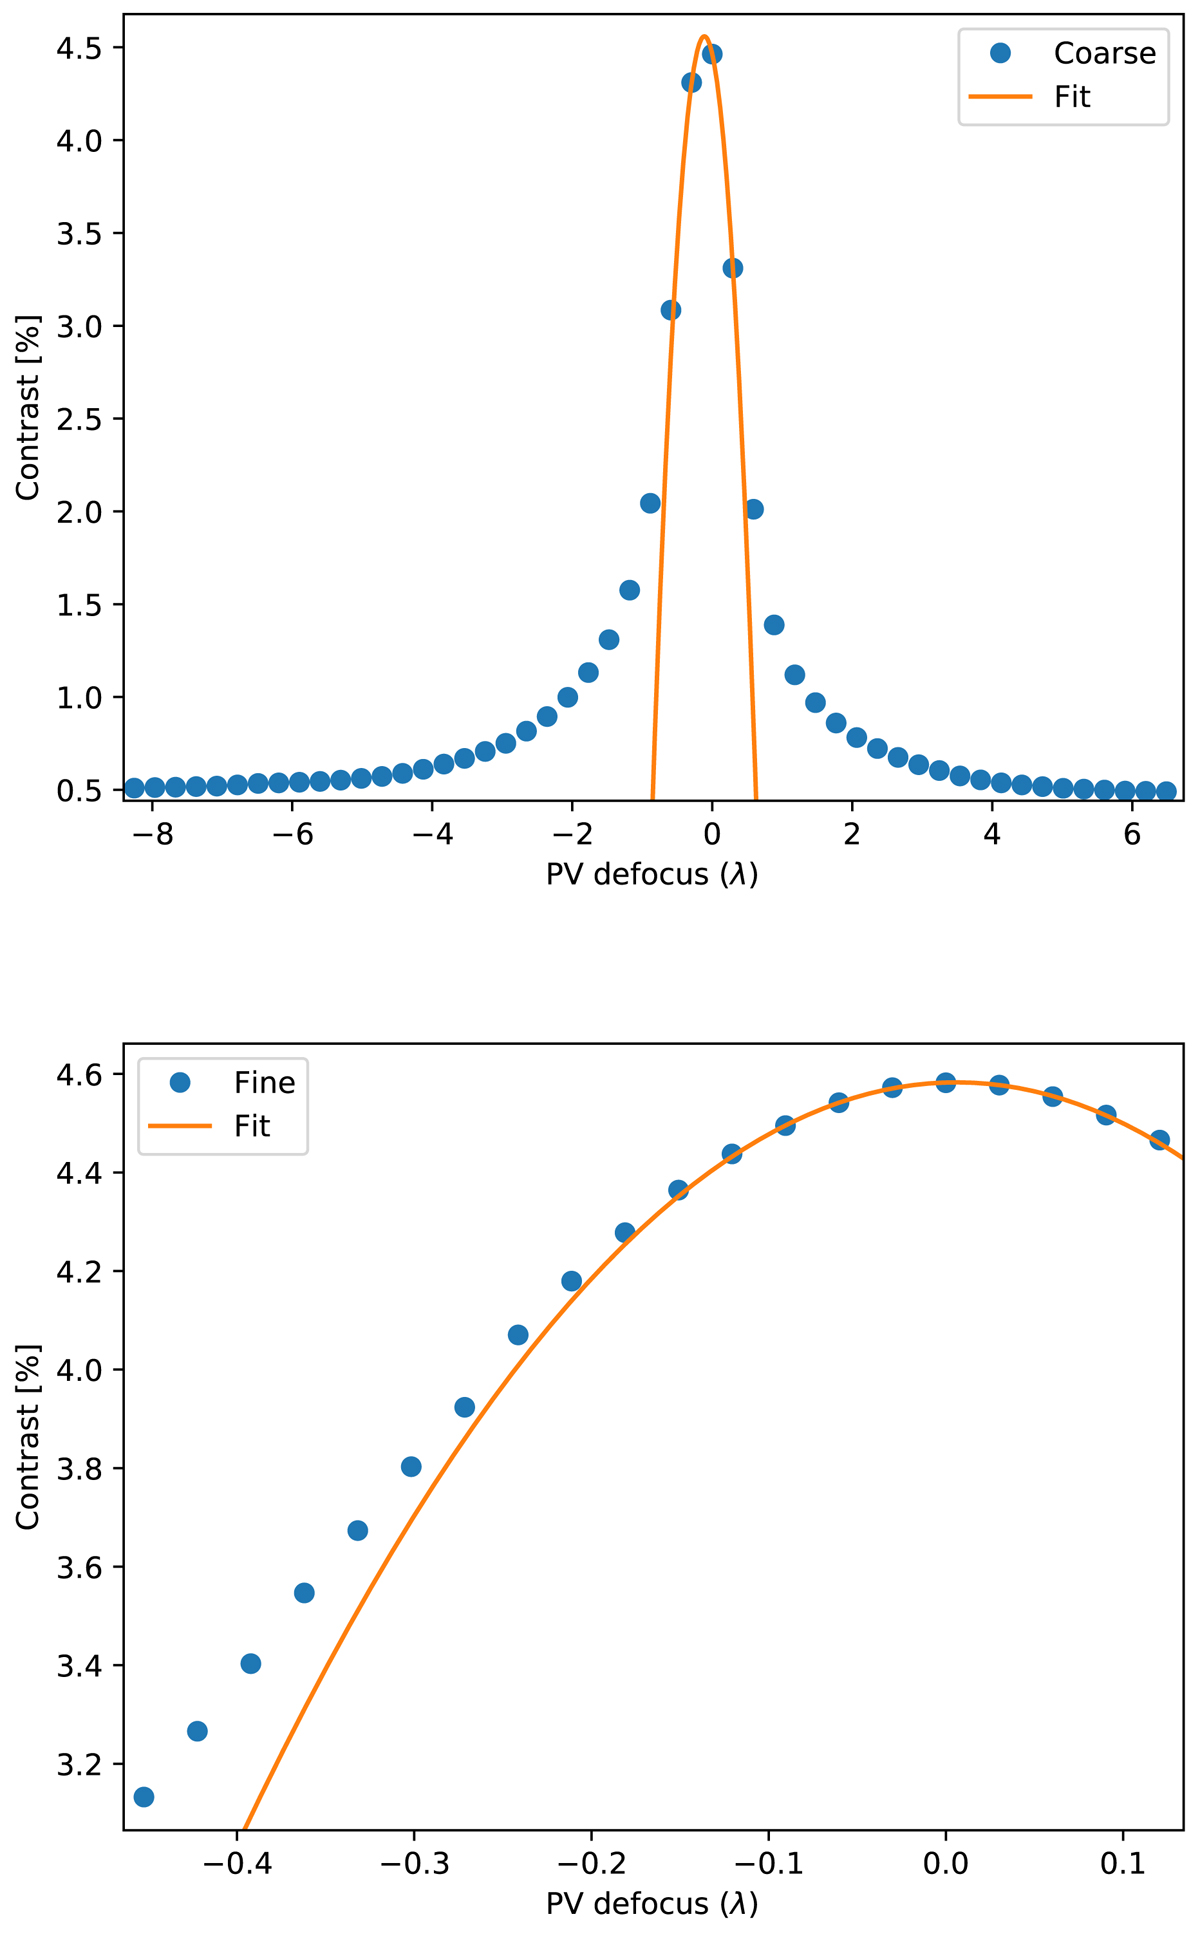
Fig. 1.
Download original image
Contrast of the through-focus images as a function of the PV defocus with respect to the best-focused image (blue solid dots) and parabolic interpolation of the data around the best-focus position (orange solid line). The top and bottom panels correspond to the coarse and fine through-focus series, respectively.
Current usage metrics show cumulative count of Article Views (full-text article views including HTML views, PDF and ePub downloads, according to the available data) and Abstracts Views on Vision4Press platform.
Data correspond to usage on the plateform after 2015. The current usage metrics is available 48-96 hours after online publication and is updated daily on week days.
Initial download of the metrics may take a while.