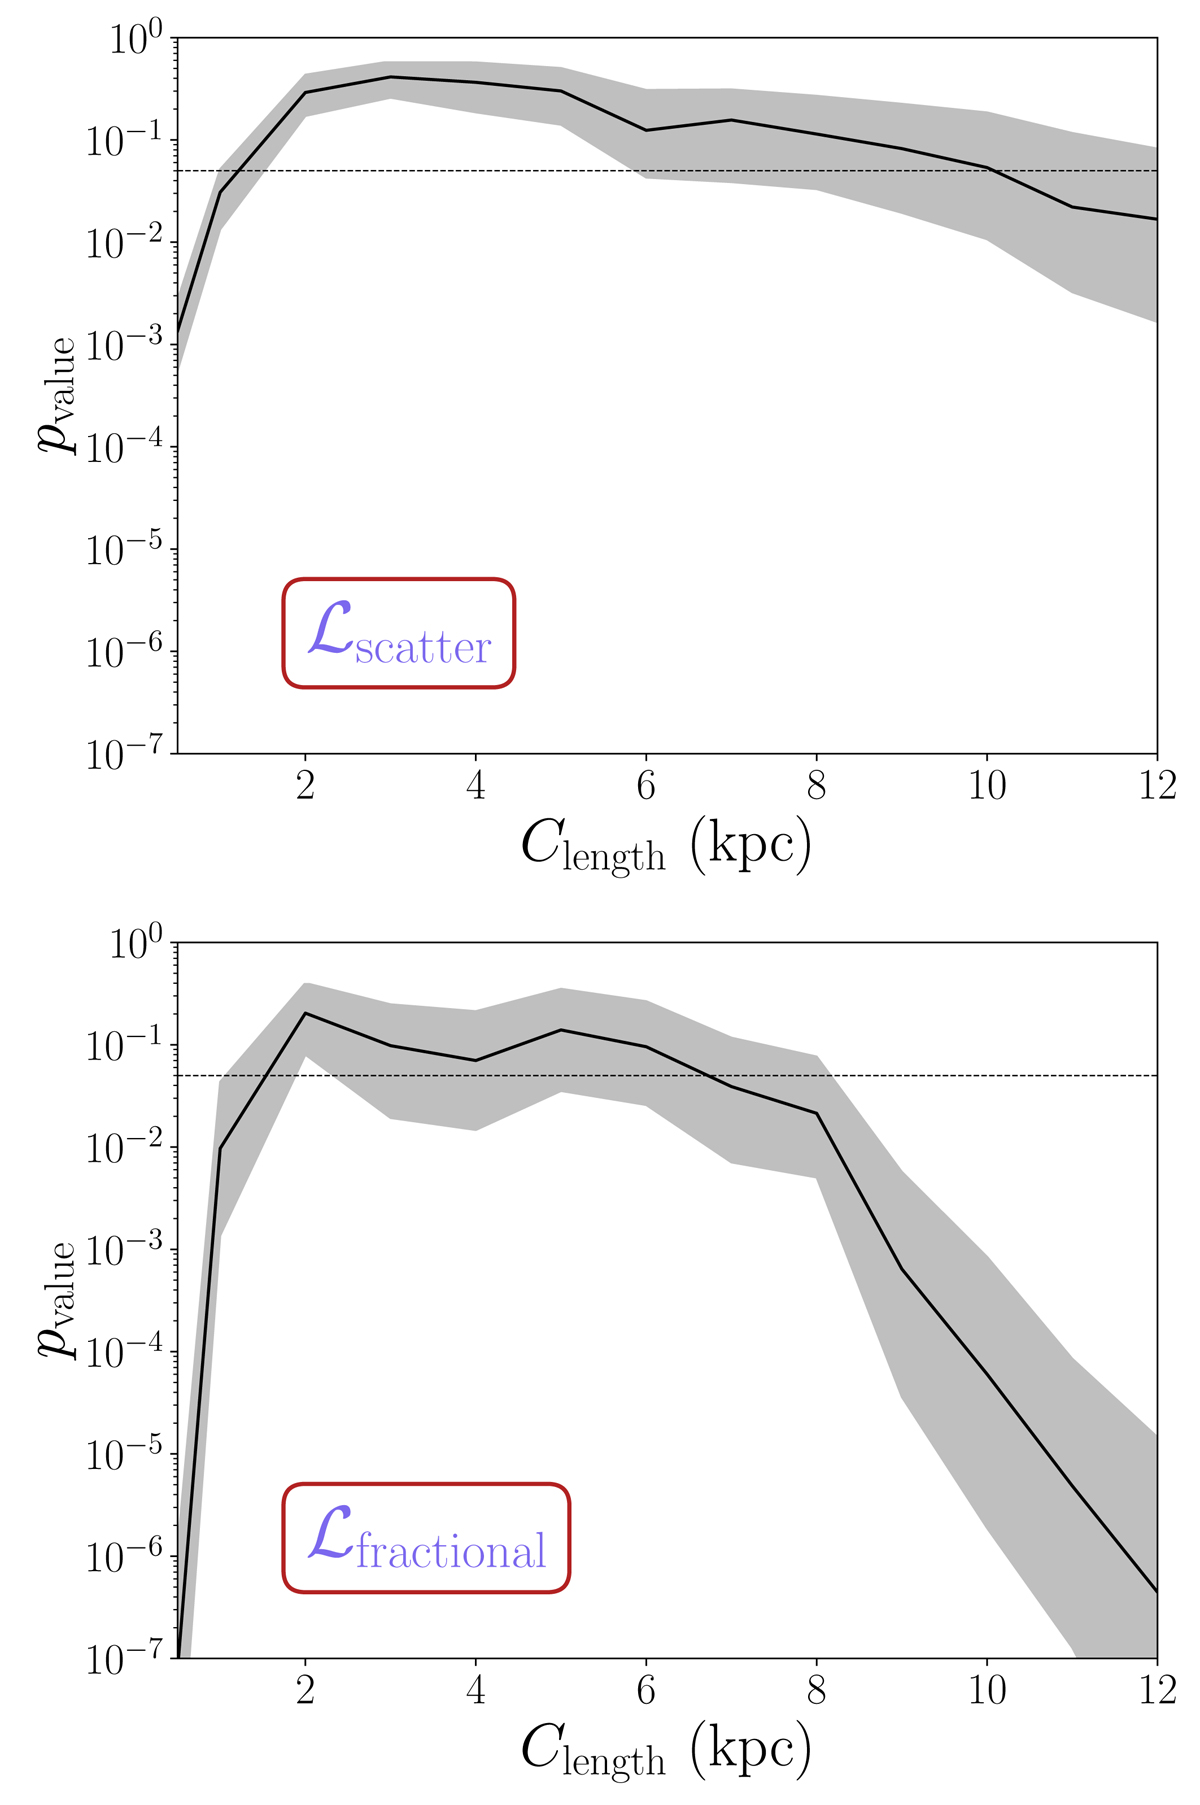
Fig. 6.
Download original image
Comparison between models with different coherence lengths and the ARCTOMO data. The two plots show the p-values of the KS test between model and data as a function of the coherence length adopted in the model. The black curve shows the median value of the 1000 realizations created for each Clength value (see Sect. 4.1), with the gray band showing the 32nd and 68th percentiles. The horizontal dotted line depicts pvalue = 0.05, meaning that models with a probability higher than this threshold can be considered in agreement with the data. Top: comparison of the scatter in the EW–R′ relation. Bottom: comparison of the EW fractional differences for spaxel separations smaller than 5 kpc. This figure shows that models with 1.5 ≲ Clength/kpc ≲ 7 are consistent with the data.
Current usage metrics show cumulative count of Article Views (full-text article views including HTML views, PDF and ePub downloads, according to the available data) and Abstracts Views on Vision4Press platform.
Data correspond to usage on the plateform after 2015. The current usage metrics is available 48-96 hours after online publication and is updated daily on week days.
Initial download of the metrics may take a while.