Fig. 5.
Download original image
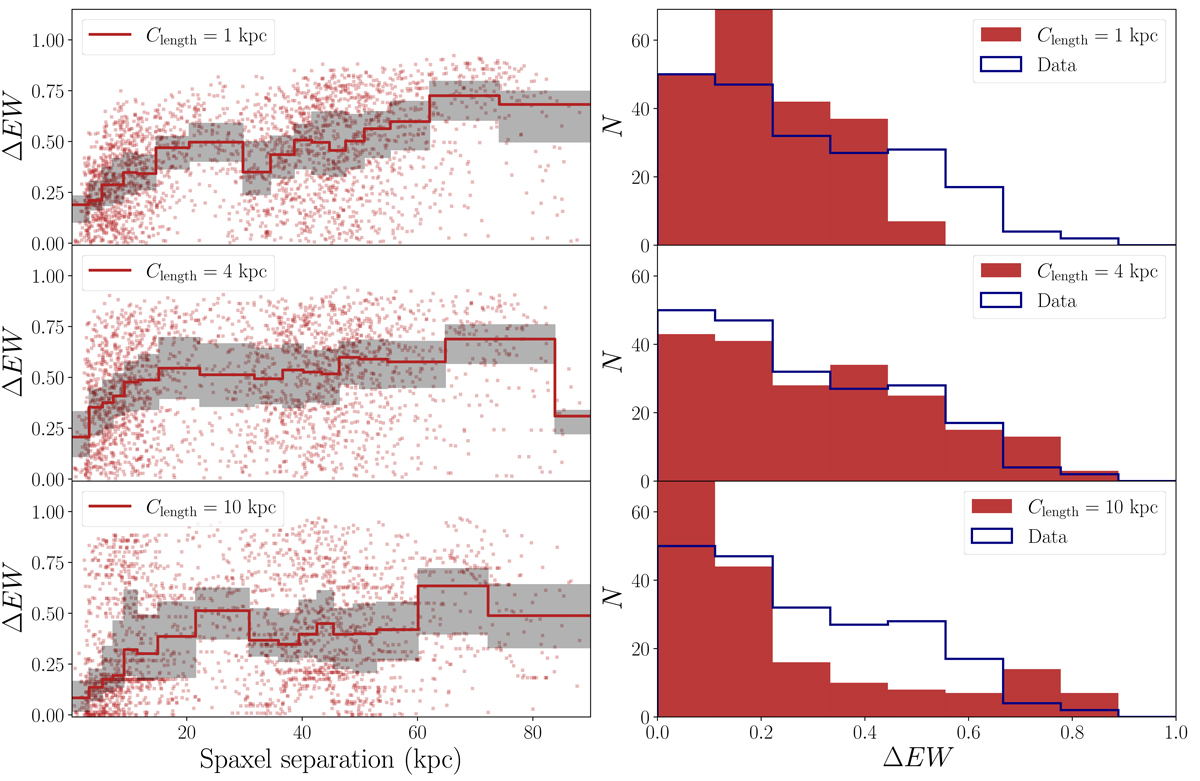
Outputs of the three models presented in Fig. 3 and used to infer the likelihood term ℒfractional. From top to bottom, the models have Clength = 1, 4, 10 kpc. Left: distributions of the fractional differences in EW as a function of the spaxel separation (same as right panel of Fig. 2, but for the models). Right: distributions for all the pairs with spaxel separations smaller than 5 kpc, for data (blue) and models (red).
Current usage metrics show cumulative count of Article Views (full-text article views including HTML views, PDF and ePub downloads, according to the available data) and Abstracts Views on Vision4Press platform.
Data correspond to usage on the plateform after 2015. The current usage metrics is available 48-96 hours after online publication and is updated daily on week days.
Initial download of the metrics may take a while.