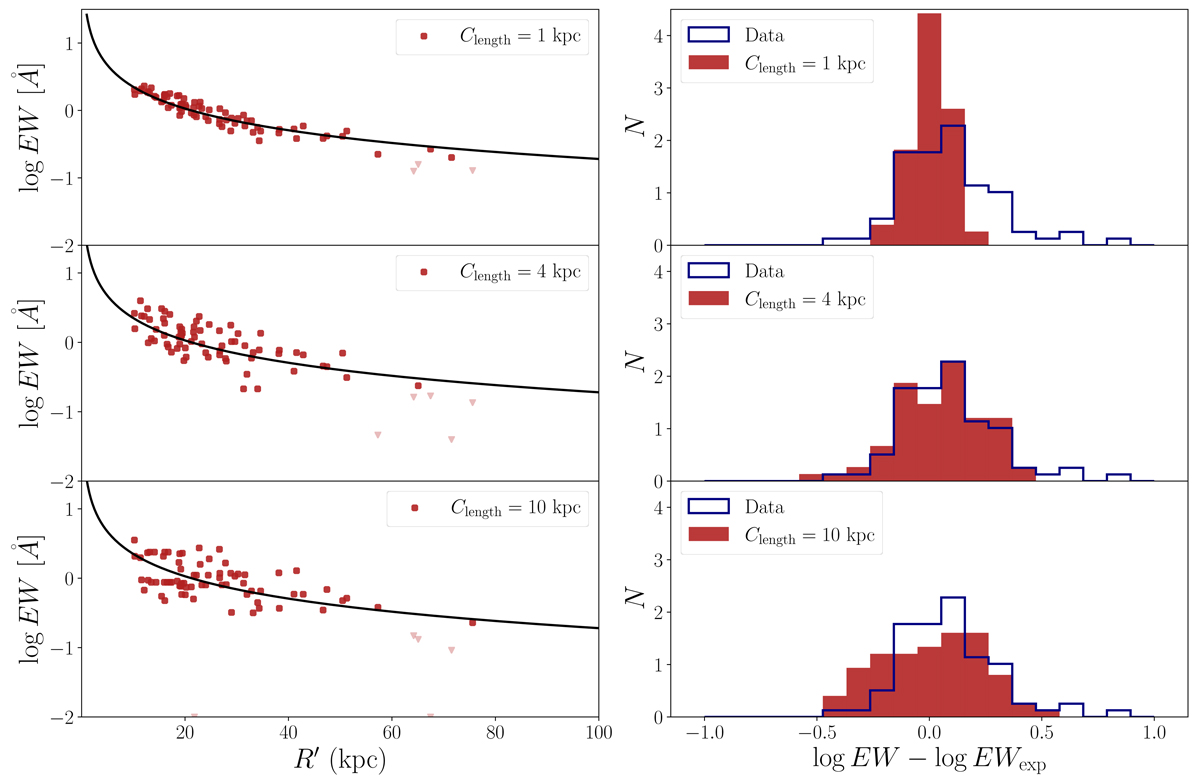
Fig. 4.
Download original image
Outputs of the three models presented in Fig. 3, used to infer the likelihood term ℒscatter. From top to bottom, the models have coherence lengths of 1, 4, and 10 kpc. Left: model EW distributions as a function of R′, with the black curve showing the relation of Eq. (2). Downward arrows show spaxels whose predicted EWs are below the detection limit of 0.2 Å and are therefore classified as “model nondetections”. Right: distributions of the differences between the EW values and the corresponding values predicted by Eq. (2), for data (blue) and models (red).
Current usage metrics show cumulative count of Article Views (full-text article views including HTML views, PDF and ePub downloads, according to the available data) and Abstracts Views on Vision4Press platform.
Data correspond to usage on the plateform after 2015. The current usage metrics is available 48-96 hours after online publication and is updated daily on week days.
Initial download of the metrics may take a while.