Fig. 2.
Download original image
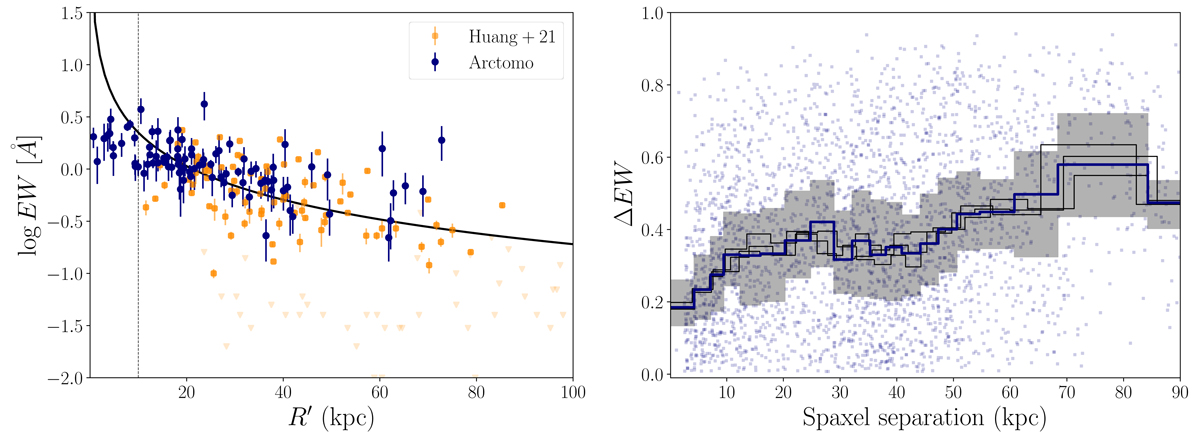
Main observational constraints extracted from the ARCTOMO data. Left: Mg IIλ2796 rest-frame EW as a function of R′ (Eq. (1)). Arctomographic data are shown in blue, and data from Huang et al. (2021) in orange, with 2σ upper limits denoted by downwards triangles. The black curve shows the best fit of the Huang et al. (2021) sample (Eq. (2)) and the vertical dashed line marks the region where our data tend to diverge from this curve (these data are excluded from our analysis). Right: distribution of the fractional difference of EW in the arctomo data as a function of the spaxel separation. The blue points show the values of all the spaxel pairs, while the blue curve and the gray band show the median values – with the 1σ uncertainties – of a binning of the same distribution (each bin contains 150 values). The black curves show the results for distributions obtained by choosing different orientation angles for the three MUSE fields (see Sect. 2.4 for more details).
Current usage metrics show cumulative count of Article Views (full-text article views including HTML views, PDF and ePub downloads, according to the available data) and Abstracts Views on Vision4Press platform.
Data correspond to usage on the plateform after 2015. The current usage metrics is available 48-96 hours after online publication and is updated daily on week days.
Initial download of the metrics may take a while.