Open Access
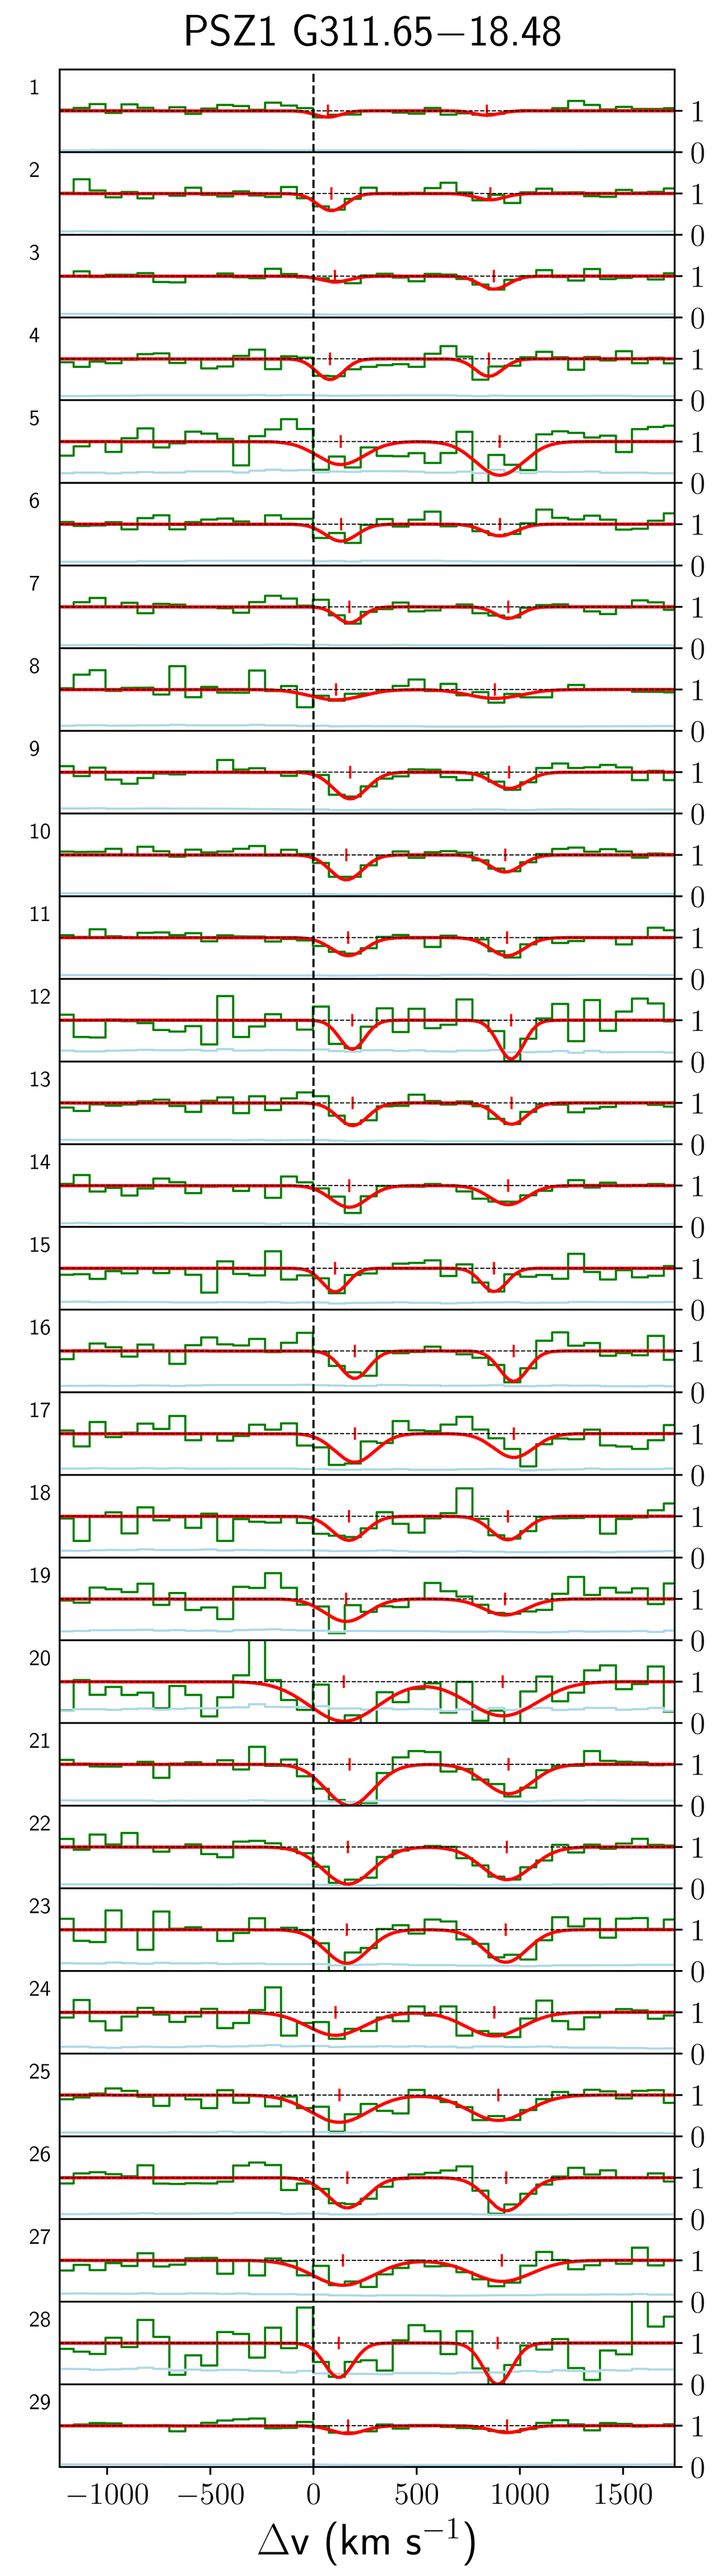
Fig. A.1.
Download original image
Results of the fitting analysis. Each panel shows a different spaxel (numbered arbitrarily) with Mg II detections in the PSZ1 G311.65−18.48 field. The normalized MUSE spectra are shown in green (uncertainties in light blue). The Gaussian fits of the Mg II doublet are reported in red.
Current usage metrics show cumulative count of Article Views (full-text article views including HTML views, PDF and ePub downloads, according to the available data) and Abstracts Views on Vision4Press platform.
Data correspond to usage on the plateform after 2015. The current usage metrics is available 48-96 hours after online publication and is updated daily on week days.
Initial download of the metrics may take a while.