Fig. 2.
Download original image
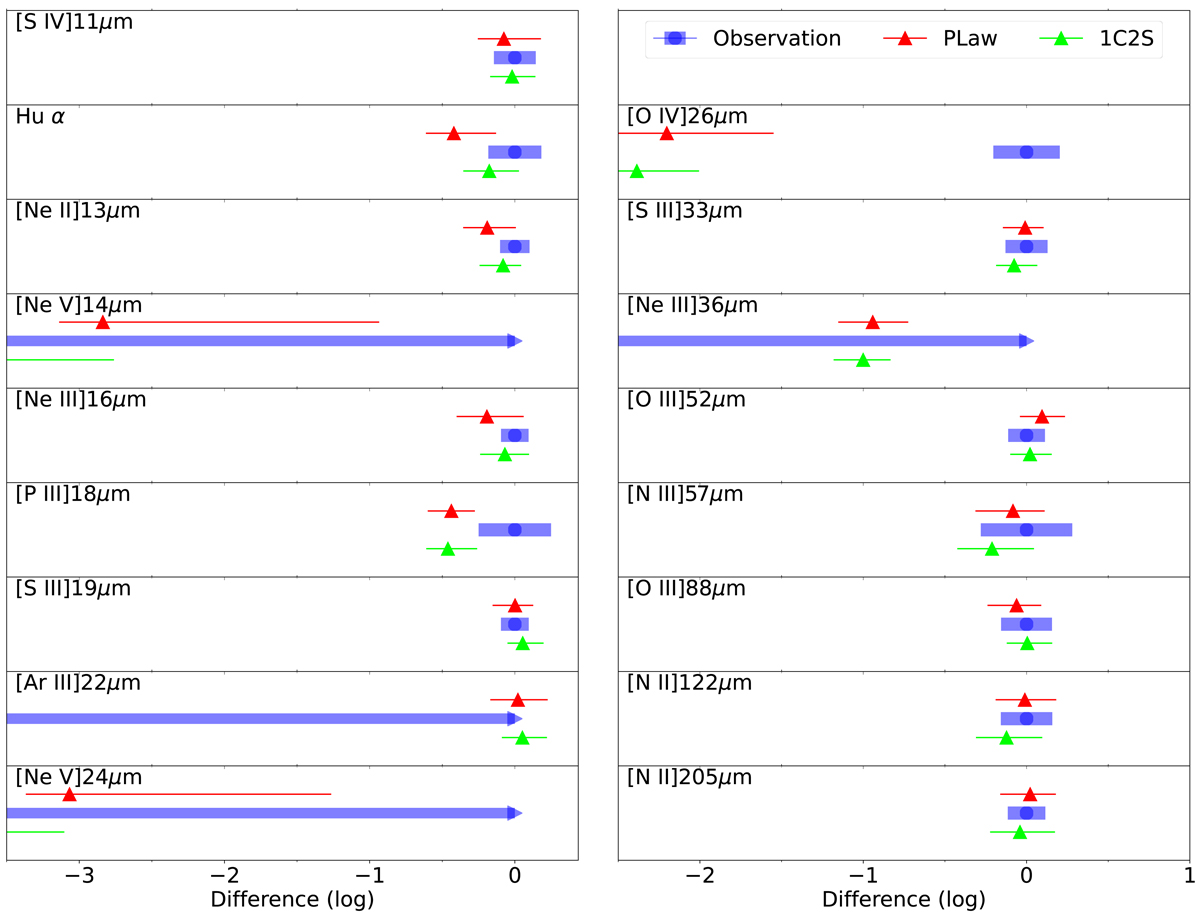
Comparison of modelled/predicted and observed line fluxes. Emission lines from the ionised gas are used as constraints. The abscissa is normalised to the observed line flux (≡0) with errorbars (blue). Red and green show the resulting line fluxes from the PLaw and 1C2S architectures, respectively. For display reasons, the abscissa in column one are compressed so that the PLaw results for the [Ne V] lines are not entirely visible. Blue arrows denote the upper limits on line fluxes.
Current usage metrics show cumulative count of Article Views (full-text article views including HTML views, PDF and ePub downloads, according to the available data) and Abstracts Views on Vision4Press platform.
Data correspond to usage on the plateform after 2015. The current usage metrics is available 48-96 hours after online publication and is updated daily on week days.
Initial download of the metrics may take a while.