Fig. 7.
Download original image
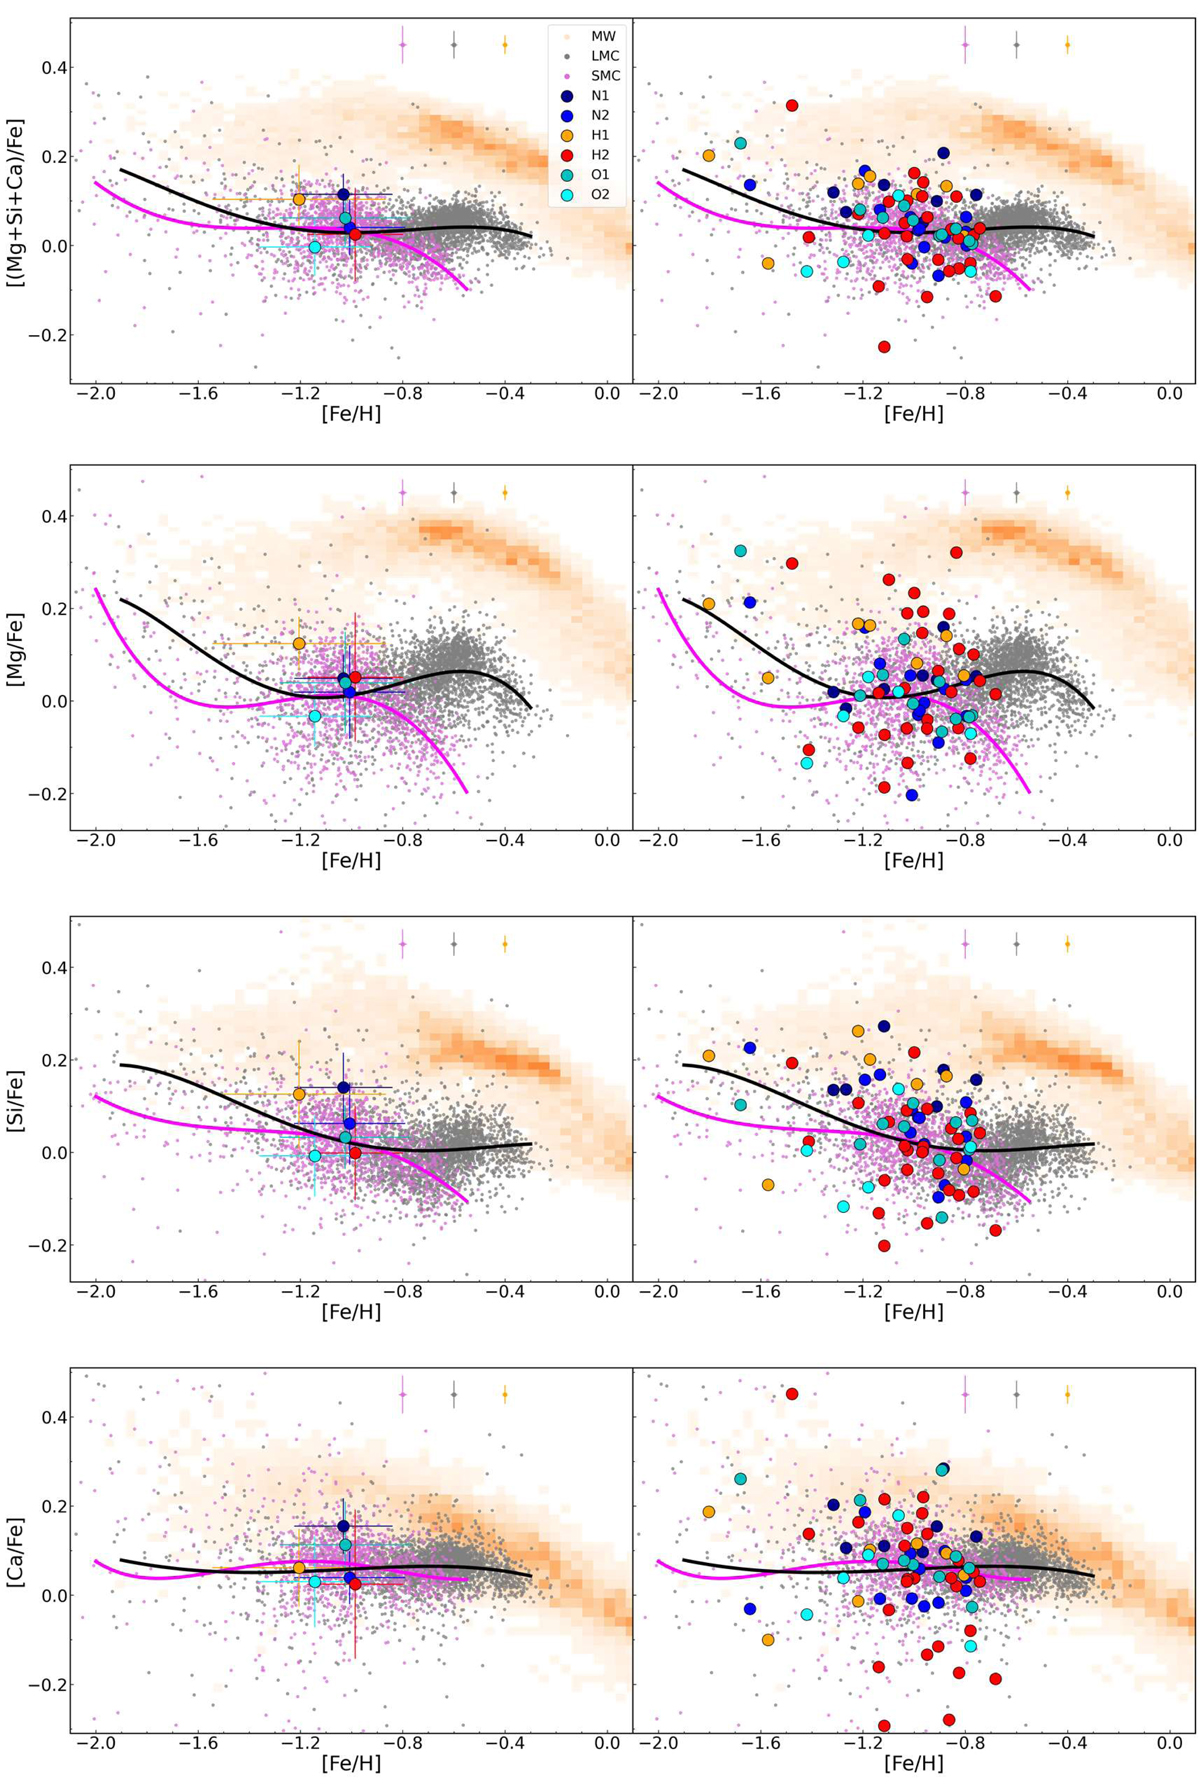
Distribution of α-abundances vs. metallicity for the LMC (small gray dots) and SMC (small magenta dots). Also included are the density of the Milky Way stars (orange) and the six substructures analyzed in this study (filled colored circles with error bars, which represent the standard deviation of each region). The left panels show the means of our substructure fields, while the right panels show the individual stars in each field. In the top right of each panel the representative errors for the LMC, SMC, and MW stars from the APOGEE pipeline (ASPCAP) are also shown. The solid black line and the solid magenta line represent the best polynomial fit for the LMC and SMC stars, respectively.
Current usage metrics show cumulative count of Article Views (full-text article views including HTML views, PDF and ePub downloads, according to the available data) and Abstracts Views on Vision4Press platform.
Data correspond to usage on the plateform after 2015. The current usage metrics is available 48-96 hours after online publication and is updated daily on week days.
Initial download of the metrics may take a while.